Blog reader Laurence Hodge has sent me some graphs, all done with ONS excess winter deaths data.
First, here’s a graph of the excess winter deaths in England and Wales going back to 1950, with a rolling five-year average in there as well, which is very revealing. These numbers are not even adjusted for population increases over that time (click to enlarge).
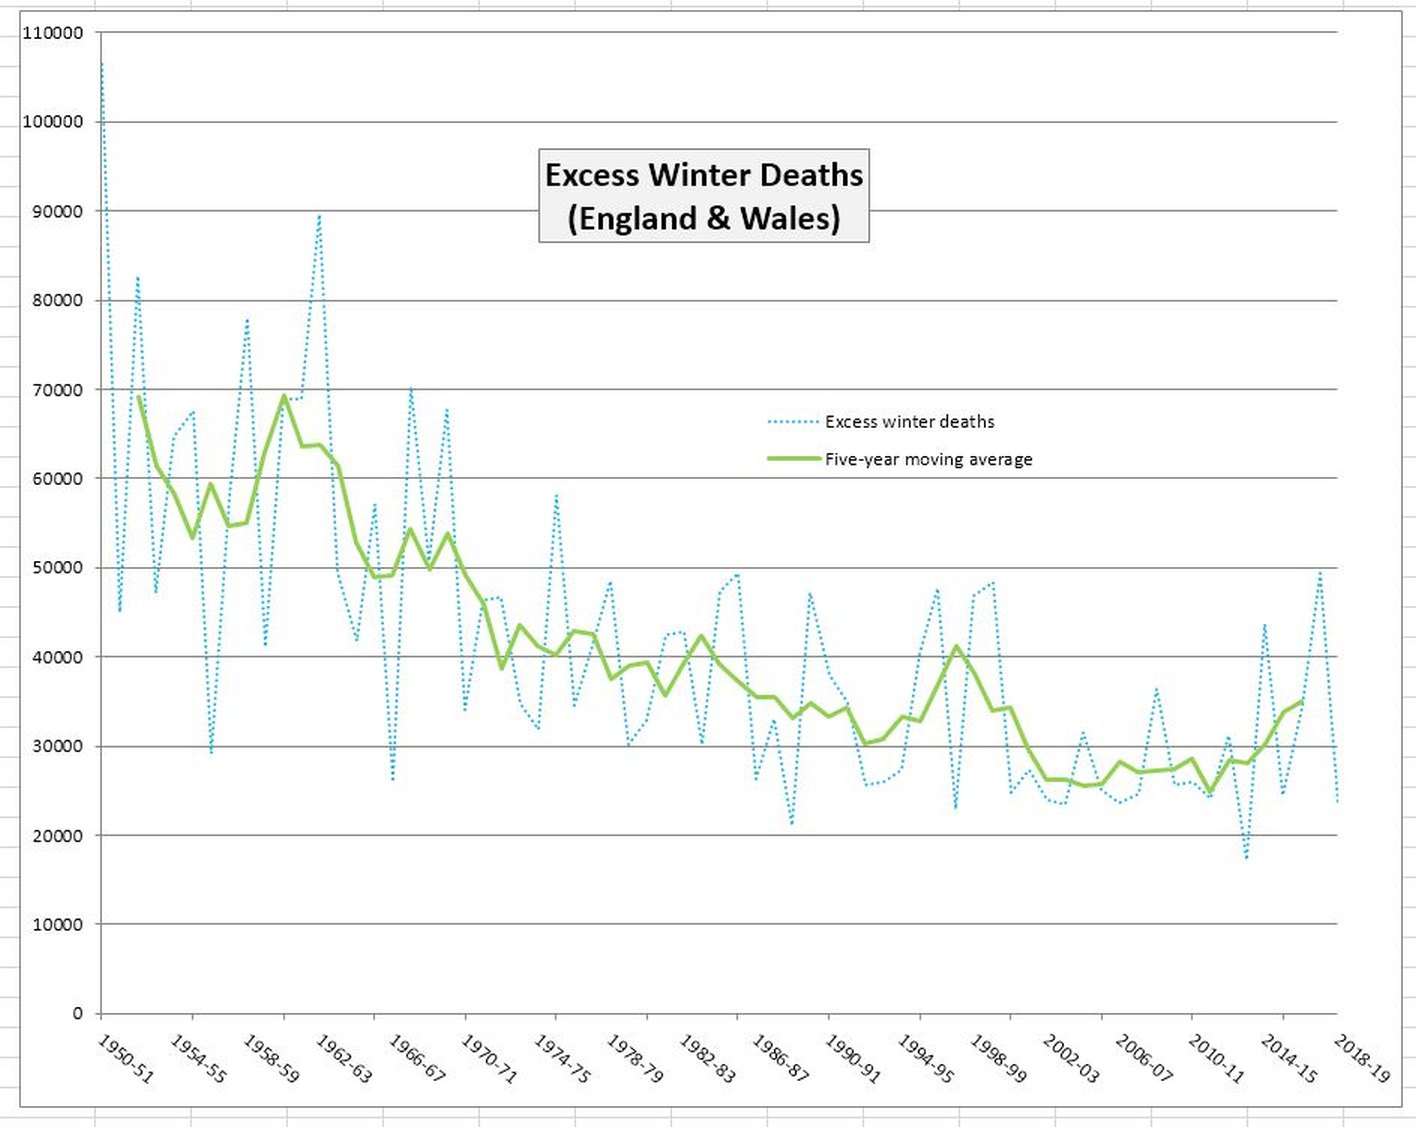
Anyone who wants to talk about a once-in-a-century mass-killer pandemic needs to get some historical perspective.
Laurence sent me his own thoughts on this:
The EWD figures from winter 1950-51 through to last winter shows that these can seesaw from one year to the next… This might be caused by a severe winter having a great impact on mortality which will have removed many vulnerable people from the population. The remaining population would consequently be relatively more robust and the EWD figure for the following year could be lower.
The five year moving average for EWD in the graph shows that actual year-to-year EWD oscillates quite markedly and although the average is rising towards the end of the period, actual EWD for last winter, 2018-19, was the fourth lowest and might reasonably be followed by an increase for the current winter.
We didn’t see many excess deaths this winter either, though, possibly because it was a mild winter (click to enlarge).
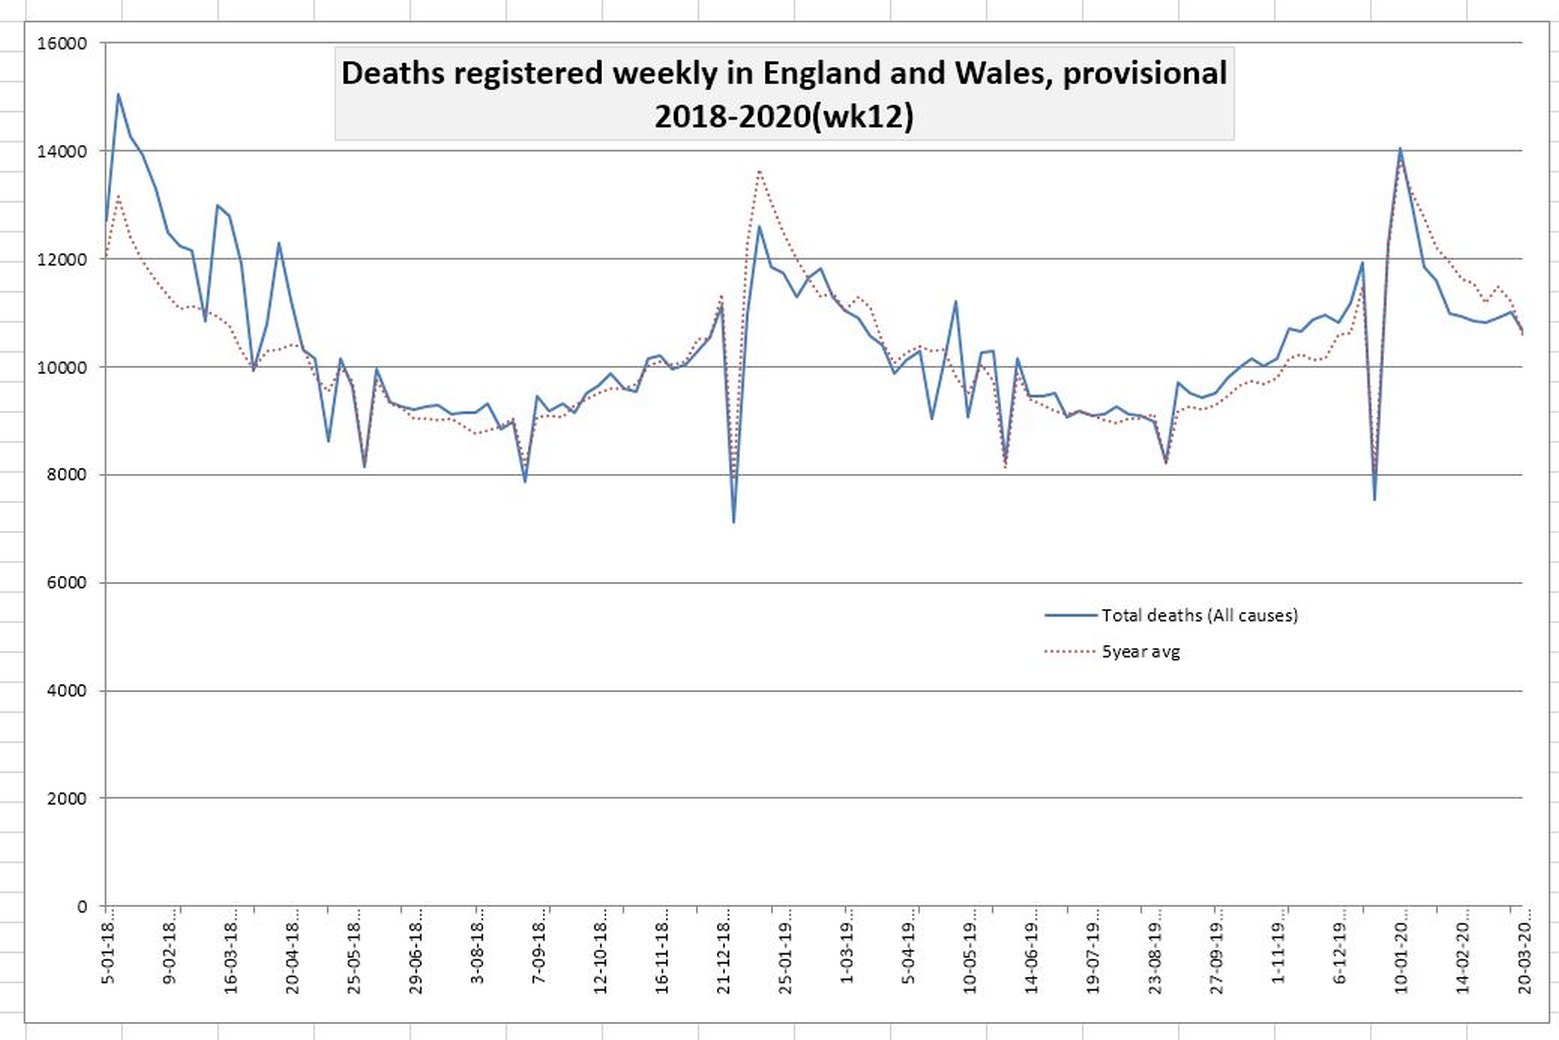
So it may well be that we have a build-up of elderly people and others with conditions who are vulnerable to a new disease coming in, so it would not be at all surprising to see some excess deaths in the next month, and particularly next winter.
Finally, there’s this graph of excess winter deaths from 2000, so you can see the recent years more clearly (click to enlarge):
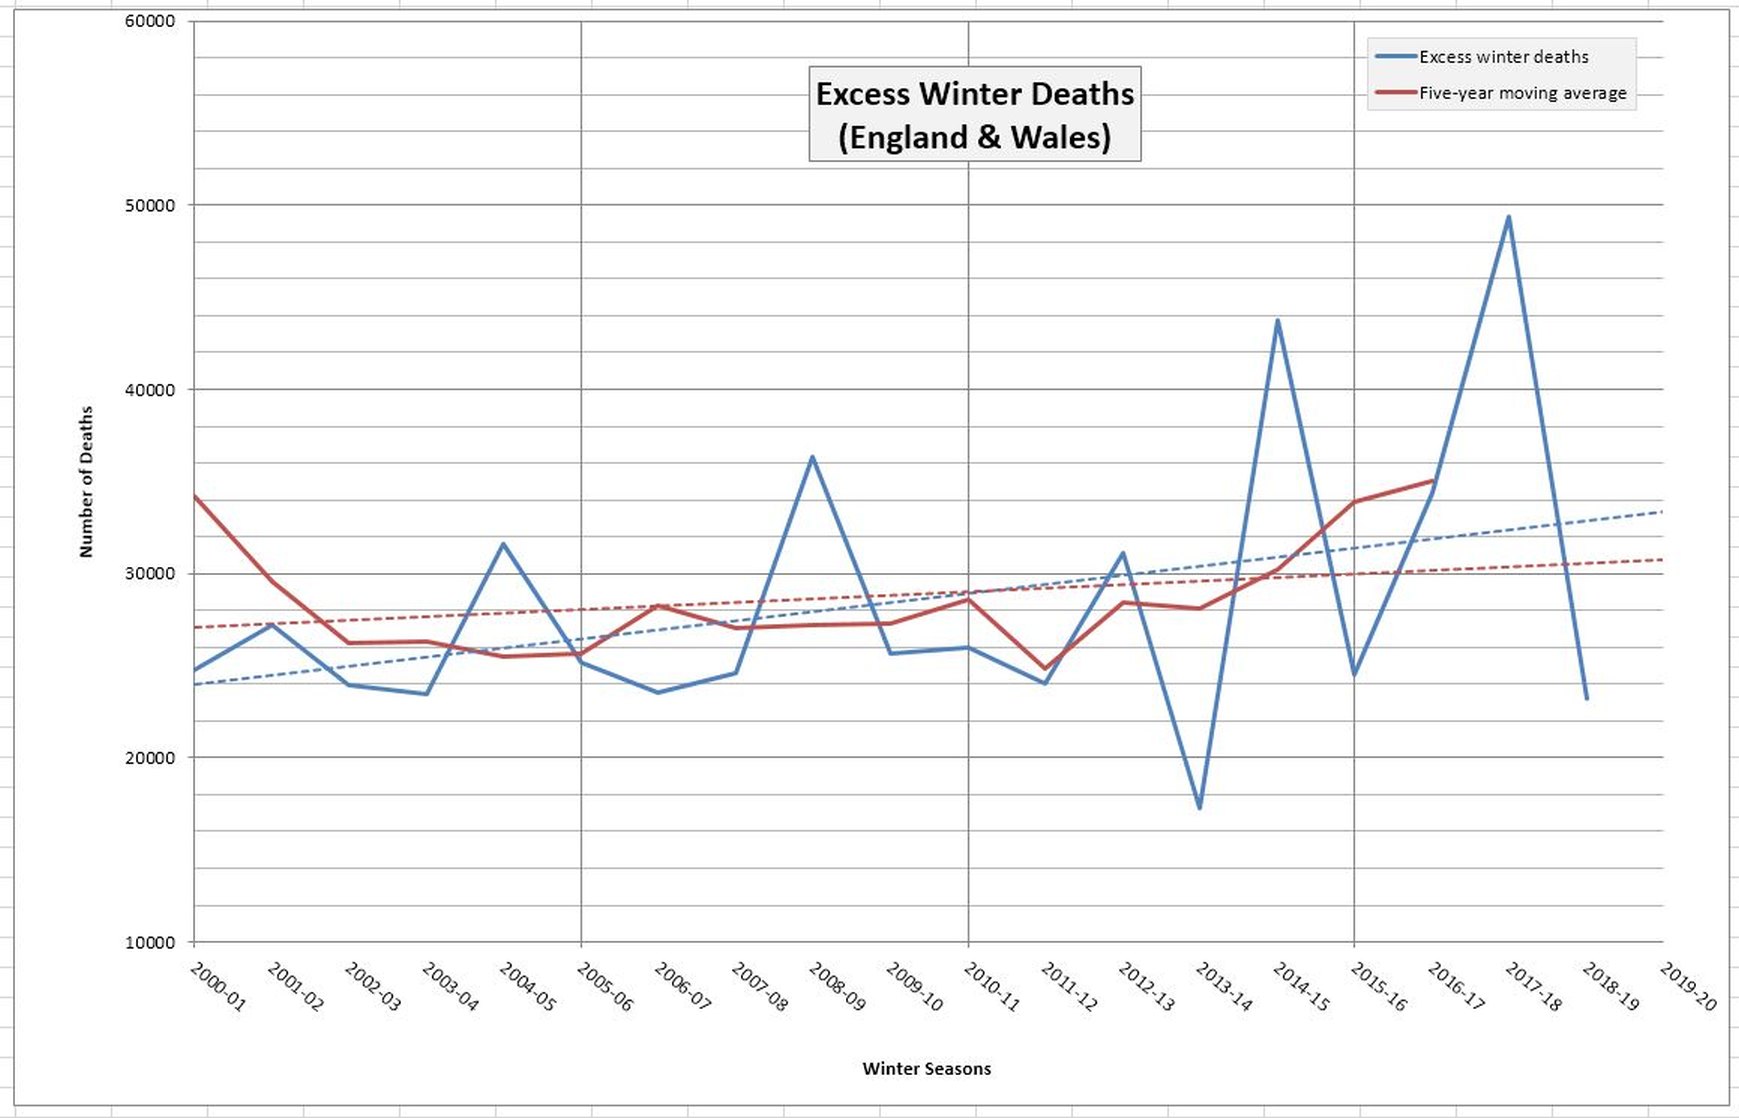
This makes it more clear that the winter of 2018-19 was low in regards to excess deaths, so combined with the low number of excess deaths that happened this winter, there’s a good chance that there will be more people vulnerable to a new disease that’s turned up.
In fact, we can see from this graph that it would have been completely normal to have had 50 000 to 60 000 excess deaths in the winter just gone, or even more. So it wouldn’t be at all surprising or worrying to have a mass of deaths over April amongst the vulnerable population who got through the mild winter, but who have just been hit by a new disease. The same applies to the winter coming later in the year, especially if it is cold.
Note: excess winter deaths are winter deaths minus non-winter deaths. Details way down near the bottom of this page.
Thanks to Laurence for the graphs and the discussion he sent me.
Update: Still got some other good graphs and diagrams people have sent me to put up, hopefully get them up later today, before the ONS release tomorrow (Tuesday).
16 thoughts on “A historical perspective on winter deaths”
Thanks for that. What I have been trying to obtain from the lockdown fans is any evidence in the past that this strategy has ever worked . Are there any previous examples with good evidence to suggest a strategy of locking up a healthy population helps contain a respiratory virus ? Any peer refernced epidimiology papers.
The suggestion that a mild flu season might leave many vulnerable people susceptible to CV implicitly makes another testable prediction. In countries which most recently had a severe flu season, one would expect CV to claim relatively few victims. I’ve read that Australia’s last flu season was its worst on record. There have so far been only 61 CV-attributed deaths in Australia, 2 deaths/million population (cf 167 in the UK).
Possibly coincidence but at least consistent.
Leaving aside CV for a moment, a remarkable thing about that first chart of excess winter deaths since 1950 is the extent of the fall. Correcting for population increase, the excess winter mortality/capita has fallen by getting on for 50%. Climate change or central heating?
I’m not sure that your suggestion “The same [mass of deaths…among the vulnerable population] applies to the winter coming later in the year, especially if it is cold.” follows. If CV kills a large proportion of the currently vulnerable population then next winter’s flu, severe or not, will have many fewer potential victims.
So if CV matches a severe flu in mortality, one might expect the death toll for the complete year (say from March 2020 to Feb 2021) to be similar to that for bad flu year.
Multiple factors I’m sure. I remember waking up with iced up windows in the early sixties in childhood – not climate change, lack of central heating. Plus slum clearances leading to housing improvements, post war general rise in prosperity, accessible health care etc etc.
Yes, in mentioning CC I was being slightly facetious. As well as central heating, the other factors you mention are significant.
It’s also interesting that almost the entire fall in excess winter mortality had taken place by the early 1980s. It’s close to flat since then.
Yep. That was my posted conclusion from graph in Gov All-Cause Mortality Surveillance 09 April 2020 – Week 15
I also believe there are brought forward deaths, even Neil Ferguson does too, of people who would die within next few weeks to 9 months
‘If it saves one life” mantra – no, it delays death unless ‘saved’ becomes immortal
@Simon Anthony
Lower last year, higher this year, next year no one knows. However, no evidence of huge spike this year yet
– 1.6 million people around the world die from TB every year it’s highly contagious don’t see social distancing or the collapse of country’s economy for that
– Situation update worldwide, as of 13 April 2020
1,807,308 cases of COVID-19, 113,513 deaths
UK All Cause Annual Deaths: ~615,000
Global All Cause Annual Deaths: ~58 Million (58,000,000)
One thing I’ve been thinking about is to what extent is this CV outbreak being made worse by the poor state of general health of the public? That is to say while the elderly have always been at risk from respiratory diseases, the working age population were probably considerably better prepared 40-50 years ago then they are today, with rampant obesity, unfitness and diabetes. Much of which is self inflicted, by lack of personal responsibility.
I also think this factor is what is driving the public hysteria over it – if this was just about ‘Is Granny going to die or not?’ it wouldn’t be any more of an issue than any ‘normal’ flu epidemic. Whats driving the hysteria is the idea that its not just Granny at risk but the younger generations too, because of their own bad lifestyle choices. For too long the public have come to think that however badly they treat their bodies, there will always be a magic healthcare pill or operation that solves the problem, without them having to take responsibility themselves. This virus is highlighting in a very graphic way that actions have consequences, and you can’t always escape them via socialised medicine and welfare systems. Thats why people are so scared – they are face to face with something that will hold them alone to account for their actions (or inactions), and it frightens the bejesus out of them.
See this paper, “Nonpharmaceutical Interventions Implemented by US Cities During the 1918-1919 Influenza Pandemic” https://jamanetwork.com/journals/jama/fullarticle/208354 “These findings demonstrate a strong association between early, sustained, and layered application of nonpharmaceutical interventions and mitigating the consequences of the 1918-1919 influenza pandemic in the United States.”
But that has been long discredited because you are comparing cities on the seaboard where soldiers came off ships from Europe with flu and cities inland requiring a train journey . It is comparing apple and pears. Can you find something a bit more recent than 1919 ?
Peter, I’m expecting some excess deaths over April, but not massive amounts. If it does kill masses over spring then yes, probably there will be less vulnerable people to kill in winter. But it is more likely to die down as the warmer weather hits. Even the government and the scientists like Ferguson seem to be expecting that.
The first outbreak in the US was in Kansas so I’m not sure the seaboard cities were the most doomed here. And I’m sorry I don’t have a more recent global flu pandemic for you! What is the earliest cut-off date from which you are willing to entertain historical evidence?
Well I am not asking that much really . Usually in medicine we like treatments to be evidence based you know Cochrane review and all that . I am asking to see if there is any evidence to show a lockdown or house arrest of a healthy population has mitigated the spread of a respiratory virus apart from discredited data from 1919.
In 2020 we at least have the ongoing example of Sweden which doesn’t have a policy of house arrest .
Comments are closed.