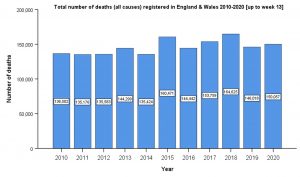
Another academic reader of this blog sent me some bar graphs based on ONS data. The first one is all deaths up to week 13 for every year from 2010 to 2020 (click to enlarge).
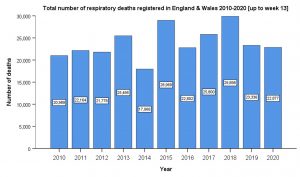
The second one is the total number of respiratory deaths in England and Wales up to week 13 for all years 2010 to 2020 (click to enlarge).
ONS week 14 data out tomorrow.
Share this article on social media:
12 thoughts on “Week 13 bar graphs 2010-20”
Lockdown is doing its idiot work–economy beginning to fall apart:
https://www.youtube.com/watch?v=4I2LKTwv4jg
This is a telling sign. Members of the media who have stoked this fire are suddenly realizing there are consequences that directly impact them;
https://twitter.com/duncangreive/status/1249807594538987520
Sorry if this has been commented on before, but I hadn’t really been paying attention to the situation in America. I just came across this piece co-authored by Anthony Fauci
“If one assumes that the number of asymptomatic or minimally symptomatic cases is several times as high as the number of reported cases, the case fatality rate may be considerably less than 1%. This suggests that the overall clinical consequences of Covid-19 may ultimately be more akin to those of a severe seasonal influenza (which has a case fatality rate of approximately 0.1%)”
https://www.nejm.org/doi/full/10.1056/NEJMe2002387
It says that it was published on February 28, 2020
A few days later he was asserting to the House Oversight and Reform Committee that it is 10 times more lethal than the seasonal flu.
https://www.youtube.com/watch?v=2DekzGCJhJw
I did wonder when they might start to realise that they were the turkeys trying to sell us on the resurrection!
From the ONS today:
“The 16,387 deaths that were registered in England and Wales during the week ending 3 April is the highest weekly total since we started compiling weekly deaths data in 2005.”
That’s not too surprising I would have thought, in that C-19 deaths are on top of what has been a substantial flu/pneumonia season which should be coming towards an end. Deaths from respiratory illness become less from about now on in most years – so that will be a test of whether C-19 will buck the usual pattern and just keep going all summer.
Up to late March there had been 23k deaths from flu/pneumonia with C-19 deaths on top of that. Hopefully as the underlying respiratory illness pressure decreases, pressure on the NHS to cope should decrease.
Also to take into consideration is this ONS statement –
Note: Deaths could possibly be counted in both causes presented. If a death had an underlying respiratory cause and a mention of COVID-19 then it would appear in both counts.
It gets a bit fuzzy.
The only thing I look at now is the total registered deaths. I find the endless hair-splitting about categorisation wearisome.
The application of Occam’s Razor is enough for me to be comfortable that when there’s an unprecedented rise in mortality in the middle of an infectious pandemic, the latter is the cause of the former.
I don’t have data for the whole period but the latest ONS figure for weekly deaths is ahead of that for 9th January 2015, which was 16,237 and was, I think, previously the highest in the past 10 years.
As the latest figures from ONS run only to 3rd April and deaths associated with CV have since stayed as high or higher than the rate around 3rd April, it seems likely that there will be several more data sets showing the number of weekly deaths at record levels.
That’s probably true Simon – it will depend how quickly the underlying flu/pneumonia deaths drop off.
The 2014/15 death toll for ILI was 28,330 spread obviously over a longer period. The total deaths in Europe for that season was 217,000 at almost 900 deaths per million.
I don’t think anyone is suggesting that C-19 is nothing, but trying to look with perspective at where we are, and whether ruining our economy and causing more death in the future is justified.
Interesting data
https://unherd.com/2020/04/jury-still-out-on-swedish-coronavirus-strategy/
http://inproportion2.talkigy.com/se_uk_compare_13apr.html
This is interesting:
“Between March 22 and April 4, 2020, a total of 215 pregnant women delivered infants at the New York–Presbyterian Allen Hospital and Columbia University Irving Medical Center . All the women were screened on admission for symptoms of Covid-19. Four women (1.9%) had fever or other symptoms of Covid-19 on admission, and all 4 women tested positive for SARS-CoV-2 (Figure 1). Of the 211 women without symptoms, all were afebrile on admission. Nasopharyngeal swabs were obtained from 210 of the 211 women (99.5%) who did not have symptoms of Covid-19; of these women, 29 (13.7%) were positive for SARS-CoV-2. Thus, 29 of the 33 patients who were positive for SARS-CoV-2 at admission (87.9%) had no symptoms of Covid-19 at presentation.”
https://www.nejm.org/doi/full/10.1056/NEJMc2009316?query=featured_home
The highest yes, but the second highest was week 2 of 2015 when there were 16,237.
Comments are closed.