Note: If you’re a new reader to my blog and you’re finding these long stats-based posts not your style, take a look through my extensive back catalogue, there’s a lot more pithy and amusing posts to see there.
It has been argued on Twitter by an Oxford don, Paul Yowell, that looking at sex differences in the latest Office for National Statistics numbers shows that the excess non-Covid-19 deaths aren’t caused by undiagnosed Covid-19, in which case it may be that they are caused by the lockdown itself.
In this thread I provide evidence that fewer than half of the 6,112 excess deaths in Week 14 are due to Covid-19. Thus most excess mortality in the UK is due to other causes: perhaps consequences of the lockdown itself, including lack of delivery of ordinary medical care. 1/
— Paul Yowell (@pwyowell) April 18, 2020
As I had been wondering the same thing, I decided to take a closer look into this.
The Office for National Statistics reports that week 15 saw 18 516 overall deaths in England and Wales, 7996 more than the five year average for week 15. But there were only 6213 Covid-19-related deaths in week 15. That’s 1783 excess deaths not accounted for by the Covid-19 numbers (and even those numbers are, as we have seen, somewhat inflated, as they are deaths that occurred with Covid-19, but not necessarily from it — according to this ONS report 86% of deaths in the Covid-19 category in March had Covid-19 as the underlying cause — but I’m going to ignore this as I’m not sure it will make much difference; anyone who thinks it will can delve further in comments).
The same sort of thing happened in week 14, as I previously blogged about. There were excess deaths (over the five-year average) not accounted for by the Covid-19 deaths. As I asked in that post, are we seeing an under-reporting of Covid-19 cases, particularly in care homes (where there aren’t many Covid-19 deaths reported), or is the lockdown itself causing deaths, with sick people afraid to go into hospital, and care home residents not getting looked after properly? Or a mix of both?
There’s no direct way of determining this, but we know that Covid-19 kills more men than women, so I took a look at the latest ONS stats, and did some more digging.
Of the 18 516 all-cause deaths, 9948 were men, and 8568 were women. (The ONS doesn’t actually release these male and female totals, but they do release sex-based age breakdowns, so you can sum up the male and female age-breakdown numbers to get these totals).
Looking at the Covid-19 deaths, of which there are 6213, we can work out that 3819 are men, and 2394 are women (again, these totals are not released by the ONS, but you can sum up the age breakdown figures for each sex). That’s 61.5% men, and 38.5% women, which tallies with what we’ve generally found out about Covid-19.
The ONS doesn’t publish the number of non-Covid deaths, but we can work these out just by subtracting the second lot of numbers from the first lot. The result is:
Non-Covid-19 deaths: 12 303
Men: 6129 (49.8%)
Women: 6174 (50.2%)
If around 1783 of these 12 303 deaths are actually undiagnosed Covid-19 deaths, and they broke down by sex in the same proportion as the Covid deaths (61.5 to 38.5), then we’d expect to see 1096 men and 686 women in that group, a difference of 410. When the remaining non-Covid deaths are added back in, we’d expect to still see more male than female deaths. But we don’t see anything like that difference between men and women here. In fact, women are slightly ahead, by 45. Which strongly suggests that those excess 1783 deaths are not undiagnosed Covid-19, but deaths caused (or mostly caused) by the lockdown.
It gets somewhat complicated here, though. Paul assumes that deaths normally divide 50/50 between male and female. But this matter is actually not at all simple. Generally in England and Wales more women die than men. You can look at the annual totals, to confirm this yourself, and here’s a snip of some of the numbers (click to enlarge):
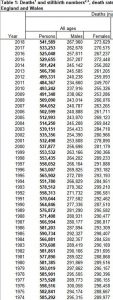
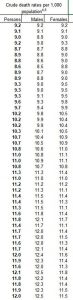
This stuff is fascinating in itself. If you look at the whole chart (on the Excel sheet, not my graphic), since 1956, when the deaths by sex started being counted, you can see that it used to be that more men died each year than women, usually by around 10 000 to 15 000. This wasn’t because there were more men: there’s also a table which has the death rate per 1000, and the men’s is higher than the women, usually by 1 to 1.5 per 1000 of population (eg. in 1960 it’s 12.2 vs 10.9 per 1000).
One might assume that this is because men did more dangerous jobs in those days, and lived unhealthier lives. I don’t really know, but the numbers do seem to account for the long-standing popular belief (in Britain, at least) that women live longer than men.
By the 1990s, however, woman catch up with men (if that’s the right term), and then by the 2000s they’re generally a little bit ahead every year. Here are the rates per 1000 for recent years (click to enlarge):
We can work out the 2014-18 five-year average for each sex (the annual numbers only go up to 2018). For men the five year average is 1 290 798 / 5 = 258 159.6. For a seven day period that’s 4951 deaths. For women it is: 1 340 171 / 5 = 268 034.2. For a seven-day period that’s 5140 deaths. That means that on average 189 more women die per week than men.
So we would expect a couple of hundred more women to have died than men in a week. This is only going to be an average, and there are various complicating factors, but it’s roughly what we can expect.
So we would expect to see that 410 difference be reduced once we add in all the remaining non-Covid deaths, but we wouldn’t expect it to reduce to zero, or to see the female figure go higher. So perhaps we are seeing a possible sign of extra deaths caused by the lockdown itself.
Nevertheless, it’s still possible, given the normal random ups and downs you get with these sorts of numbers, that there were more female deaths than normal that week, and so this statistic may not be telling us anything. The difference isn’t big enough for us to be too confident on that.
On the other hand, when I looked at the sums for weekly male vs female deaths in spring 2019, the differences are all pretty small. (These sums are not published, you have to use Excel’s summing function to see them). That suggests that we should still see a substantial difference between males and females in those 12 303 non-Covid deaths. So it’s complicated, but maybe there were lockdown deaths in week 15. But as I said, we can’t really be confident either way.
To get a fuller picture I ran the same sort of analysis on the week 14 data. We had an excess of 6082 deaths in week 14 over the five-year average, and 3475 official Covid-19 deaths, leaving 2607 excess non-Covid deaths. For the Covid deaths we had a percentage breakdown of 61-39 male to female. So if that 2607 were really undiagnosed Covid-19 deaths we’d expect to see 1590 male deaths and 1017 female deaths, a difference of 573. We’d expect to see something in the same ballpark remain when we add the remaining non-Covid deaths back in (most likely a number 100-200 less than that). And the eventual difference between male and female for non-Covid deaths turns out to be 424, which is in the same ballpark (and 149 less). So for week 14 I would say that probably many of the excess non-Covid deaths are really undiagnosed Covid-19 deaths.
That also means that the week 14 analysis doesn’t provide any support for the idea that the week 15 excess non-Covid deaths are lockdown deaths, rather than undiagnosed Covid deaths. But it still remains possible that there were hundreds of lockdown deaths that occurred in week 15. This would make sense if we’re thinking that there may be hundreds or even thousands of people who are seriously ill, or who have chest pains, etc., who are not going into hospital. We’d expect to see more deaths amongst such people a bit later on in the lockdown process, as those people get sicker and die.
However, there is the complication in all this that delays in registration of deaths at the moment mean that the relation between the date of death and the week the death is registered in the ONS figures is much more out of kilter than usual, so, as I said, one should be reluctant to draw any strong conclusions just from that data.
Update: The figures all put together for those who are interested:
The week 14 figures:
All-deaths: 16 387
Five-year average: 10 305
Excess: 6082
Men: 8794 (53.7%)
Women: 7593 (46.3%)
Difference: 1201
Covid-19 deaths: 3475
Men: 2126 (61%)
Women: 1349 (39%)
Difference: 777 (22%)
Non-Covid-19 deaths: 12 912
Men: 6668 (51.6%)
Women: 6244 (48.4%)
Difference: 424
Excess over five-year average: 2607
– if these 2607 were Covid-19 deaths we’d expect to see 1590 male deaths and 1017 female deaths, a difference of 573.
The week 15 figures:
All-deaths: 18 516
Five-year average: 10 520
Excess: 7996
Men: 9948 (53.7%)
Women: 8568 (46.3%)
Difference: 1201
Covid-19 deaths: 6213
Men: 3819 (61.5%)
Women: 2394 (38.5%)
Difference: 1425 (23%)
Non-Covid-19 deaths: 12 303
Men: 6129 (49.8%)
Women: 6174 (50.2%)
Difference: 45
Excess over five-year average: 1783
– if these 1783 were Covid-19 deaths we’d expect to see 1096.5 male deaths and 686.5 female deaths, a difference of 410.
Update 2: Paul Yowell has been in touch to say that the 2020 figures look more 50/50, so I will look at that later.
Update 3: David Clark in comments offers this analysis on the issue:
Two observations.
The comparison of this week with the same week average for past years may not be the best way to think of the excess as there are lots of peaks and troughs at this time of year.
“deaths that occurred with Covid-19, but not necessarily from it — according to this ONS report 86% of deaths in the Covid-19 category in March had Covid-19 as the underlying cause”
Having delved a bit into this business of ‘underlying cause’
[https://www.gov.uk/government/publications/guidance-notes-for-completing-a-medical-certificate-of-cause-of-death] I have come to the conclusion that my earlier understanding that ‘of’ would also show as a ‘respiratory death’ is not how it works. The figures in weeks 14–15 for respiratory deaths show a peak that would be quite unexceptional for a flu outbreak late in the season, this year it just happens to be WuFlu. That 86% ‘COVID-19 as underlying cause’ are the ones where there is, according to medical opinion, not a pre-existing condition that would have caused death anyway. That leaves open the question of how imminent death from some other condition needs to be before it, rather than COVID-19, is considered the underlying cause. Perhaps that will be answered when, some months or years hence, there is a decline in mortality when there are fewer vulnerable people left.
My summation as at week 15 (and ignoring for the moment the increased numbers that will appear in the next few weeks): Deaths in 2020 up to week 15 are 185,000, 10,000 above average, respiratory deaths are nothing unusual (27,000) So 10,000 COVID-19 registered to week 15 is enough to account for the rise above average to date (6%).
9 thoughts on “Do the ONS numbers show that the lockdown is killing people?”
Hi Hector – many thanks for all the effort you put in to these analyses, and thanks too to your friends. It really is a beacon in a world of incoherent statistical analysis. Listened to your podcast with Dellingpole too, excellent.
I second “NeverReady’s” thoughts. Here are some stories in the Mail (yes, I know…) that may be of interest:
https://www.dailymail.co.uk/debate/article-8239011/The-brains-wonder-coronavirus-test-grandson-press-baron-writes-ROBERT-HARDMAN.html
https://www.dailymail.co.uk/news/article-8242755/NHS-Nightingale-Hospital-London-ExCeL-Centre-rejects-patients-lack-nurses.html
https://www.dailymail.co.uk/news/article-8242789/2-700-cancers-MISSED-week-Coronavirus-crisis-causes-urgent-GP-hospital-referrals-plummet.html
And one which particularly affects me (64):
https://www.dailymail.co.uk/news/article-8243401/Coronavirus-total-isolation-shielding-extended-60s-experts-warn.html
Two observations.
The comparison of this week with the same week average for past years may not be the best way to think of the excess as there are lots of peaks and troughs at this time of year.
“deaths that occurred with Covid-19, but not necessarily from it — according to this ONS report 86% of deaths in the Covid-19 category in March had Covid-19 as the underlying cause”
Having delved a bit into this business of ‘underlying cause’
[ https://www.gov.uk/government/publications/guidance-notes-for-completing-a-medical-certificate-of-cause-of-death ] I have come to the conclusion that my earlier understanding that ‘of’ would also show as a ‘respiratory death’ is not how it works. The figures in weeks 14–15 for respiratory deaths show a peak that would be quite unexceptional for a flu outbreak late in the season, this year it just happens to be WuFlu. That 86% ‘COVID-19 as underlying cause’ are the ones where there is, according to medical opinion, not a pre-existing condition that would have caused death anyway. That leaves open the question of how imminent death from some other condition needs to be before it, rather than COVID-19, is considered the underlying cause. Perhaps that will be answered when, some months or years hence, there is a decline in mortality when there are fewer vulnerable people left.
My summation as at week 15 (and ignoring for the moment the increased numbers that will appear in the next few weeks): Deaths in 2020 up to week 15 are 185,000, 10,000 above average, respiratory deaths are nothing unusual (27,000) So 10,000 COVID-19 registered to week 15 is enough to account for the rise above average to date (6%).
Thanks, have added this to the bottom of the post.
I am never big on conspiracy theories – tending to believe the cock-up is more likely – but the current situation is looking like a dangerous mix of the two.
This vid posted in a comment by elizabethhart over at Doc Kendrick’s establishment is well worth a view – scary and I am not easily scared. It is American , but Prof. Ferguson gets a part. Long but worth watching to the end.
https://www.youtube.com/watch?v=1JLBXfKDbbI&feature=share
“Deaths in 2020 up to week 15 are 185,000, 10,000 above average, respiratory deaths are nothing unusual”
The intriguing feature about the ~6% rise in cumulative registered “All Causes” deaths to Week 15 is that — while the great majority (87%) of those 11,500 “above average” deaths are of people over 65 years old — we see more or less the same ~6% rise in cumulative deaths of people under 65 as of people 65+.
Most of the “extra” deaths are indeed of older people, but perhaps that is because most of the “average” deaths are normally of older people.
One interpretation of the registered deaths statistics is that the only people who are at risk from C-19 are those who already have existing medical problems — regardless of whether they are young or old.
If sanity ever reigns and we get round to protecting the At Risk population instead of locking down those who are not at risk, this could imply that the number of people who need to be protected is significantly smaller than “All People Over 65”.
You are making it all rather complicated. Let’s just compare ONS data of total deaths week before the Government’s lockdown to the week after, ie weeks 10 and 11: that gives 5% more total deaths after it. Then do the same two weeks before compared to two weeks after, ie weeks 9&10 compared to 11&12: that gives 27% more deaths. Then do the same 3 weeks before compared to the three weeks after lockdown, and that gives 41% more. That’s about thirteen thousand more deaths comparing the two three-week periods, before & after.
This is certainly not promoting public health. Is this some kind of subtle mass murder program?
“7996 more than the five year average for week 15.”
This number is compared with the 5-year average. But even within those five years, it seems (from your graph in a previous post) that the variability across it is up to plus or minus 2000 deaths.
As the commenter djc above said, the week 15 data in the past had many peaks and troughs.
So, getting 7996 from an average of a dataset with 5 points that have a high degree of variability, can you use that number with such high precision as to calculate the number of excess deaths not attributable to Covid-19?
Comments are closed.