
This is a guest post by John Church. John is an oil and gas professional and has spent some 30 years working for one of the biggest oil companies in the world.
A week ago, I posted a simple model for predicting mortality based on the ‘accidental experiment’ of the Diamond Princess cruise ship, but also based on some basic observations around hospital death rates for different age groups, primarily from Lombardy in Italy.
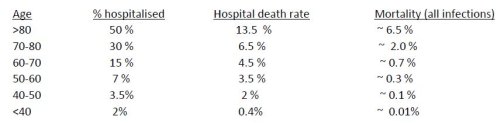
I have fine-tuned these numbers, whilst attempting to maintain the simplicity of the model, to try and also match other observations, such as the percentage of deaths being observed in various age groups from different countries and other datasets that are becoming available. Particularly, I wanted to match the actual age distribution of Covid-19 deaths coming from the weekly update of the UK Office of National Statistics, and also include the fact that some people under the age of forty were fatalities, although very small in number. The fine-tuned numbers are below and are slightly different from the original post, but as further data has become available, the death numbers have consistently continued to support the key assumptions in the model.
As a check on the reasonableness of this update, a hindcast view on the Diamond Princess data gives the result of 21% hospitalised and 11 deaths, quite close to the original observations. The model is a very simple XL sheet and can be accessed here, for anyone interested:
Corona_data_post_calc-J_Church
The model also now incorporates the varying population distributions of different countries which allows for a smarter matching of individual country observations, and has also demonstrated how very sensitive average country mortality rates are to the age distributions in those countries. For example, the UK has an average mortality of 0.6%, whereas Italy, with its slightly older population distribution has a mortality just under 0.8%. At the other end of the spectrum is India, with a very young population (average age is 28) and has an average mortality of less than 0.2%. A variation which occurs solely as a function of the age distribution. I have also included London as a ‘country’ to be able to see the difference between our younger capital city and the older UK average. The graph below shows the results for various countries as a plot of average age vs. average mortality (click to enlarge).

So what does this mean for average mortality and infection spread in the UK?
This update with slightly increased average mortality (0.6%) would lead to expectation UK deaths of 240 000 if we assume we end up with 60% of the country exposed to Covid19. It is difficult to know the exact death toll from the infections so far because a lot of deaths are still to occur from the current infections. The UK currently has about 27 000 deaths, a number which now includes care home deaths. By analysing the shape of the daily deaths curve from the UK (and other countries) it would appear that we are approximately half-way through this current wave, so this would predict approximately 55k deaths.
If that was the case, with a 0.6% average mortality, it means about 9 million infections, some 14% of the nation, in line with estimations from the previous post. If we use the London information and assume one-third of UK deaths are in the capital, it leads to a view that approximately 4 million Londoners (45%) might have been infected, using the average London mortality of 0.44%. The incoming information from both the new app recently released in the UK, and also the random antibody testing that has now begun, will shortly tell if this is a reasonable view.
Mitigation Philosophy : Control and Prevention vs. Acceptance and Achievement?
With the exception of Sweden (and possibly Brazil), the world’s mitigation philosophy so far has been one of control, prevention and even aspired eradication. But the numbers above must bring into question the wisdom of this approach. It seems to me, in line with my previous post, that it is increasingly clear that the virus remains highly infectious and widespread, and cannot be eradicated. So any lockdown just delays the problem and brings with it a host of new problems: economic, societal and medical. Whilst there is an argument for buying time to allow appropriate medical logistical response (‘protect the NHS’), once that has occurred, would it not make more sense to use the younger portion of the population to get this virus through the country as quickly as possible ? If we change our mindset on this, it will change the language from preventing infection to achieving infection.
I remain of the view that Sweden has the best approach and we need to actively monitor their efforts. So far there has been no loss of control and applying the same logic as above (the model predicts an average mortality for Sweden of 0.64%) leads to a view that they have achieved an infection rate of over 10% of their nation, reportedly with up to 30% in Stockholm. Norway by contrast (average mortality 0.53% due to
the much younger population – who knew that?), has achieved an infection spread of only 2%. New Zealand has barely started and only achieved 0.2%.
The average mortality numbers above must also seriously bring into question the responses of places like India. With a predicted mortality of 0.19% and an average age of 27 it seems bizarre that they have attempted to put their entire country (all 1.3 billion) into lockdown. The model predicts about 1.5 million deaths total in India (with an assumption of ultimately 60% infection), and we must ask what a lockdown will achieve other than delaying this.
And to put this in perspective, it is worth noting that around ten million people die in India every year, including some three million children under the age of five. How will an economic lockdown help that awful statistic ? I appreciate that it is unfashionable to ask this, but I’m going to anyway. Is it possible that we have we all over-reacted ? That really is the question.
42 thoughts on “John Church: Update on Diamond Princess / Lombardy Model for Predicting Mortality and Infection Spread”
“Is it possible that we have we all over-reacted ?”
Please sir, may I be excused from that “all”?
There have been lots of people since the beginning of this shambles — and certainly since the Diamond Princess — shouting that the appropriate approach was to protect the small At Risk population and keep the working age population at work and getting infected (with minimal risk of lethality).
My county fire department has just banned weed burning, officially as part of their effort to stem C-19. (If you are like the rest of us, you missed the epidemiological studies demonstrating the link between weed burning and C-19). Every little Hitler in every little bureaucracy has seized on this not-unusually-lethal virus to bully the peons. Back in China, the leaders of the Communist Party must be rolling on the floor splitting their sides laughing at how dumb we honkies are.
Thanks Simon, great analysis (and a regression line on your graph would have a very strong r-squared). Agree with your conclusions which I simplify as “which cohort do you want to be in the 30% that doesn’t get it? The old or the young? Choose!”
Unless treatments or a record breaking vaccine development happen, nearly 250,000 are likely to die over the next year or so. No government could ever go public with such a number. Not sure how they stop it happening.
“nearly 250,000 are likely to die over the next year or so.”
Do you mean “in the whole world” Nick?
As world govt seems an aspiration of those orchestrating the house arrest strategy, that might affect a world govt.
For each country in western Europe, and the US, the death rates equal a bad flu.
“nearly 250,000 are likely to die over the next year or so”
If 2020 is anything like 2019, about 530,000 Brits will die this year. Along with about 2,850,000 Americans and an astounding 9,125,000 Chinese. Death — there is a lot of it around these days.
In isolation, 250,000 is a sobering number, which on it’s own, no government in the UK could face.
What’s not clear and I guess won’t be for a long time, is what’s the real incremental impact of CV19 and have any of the measures taken by governments around the world made any difference.
As Hector has pointed out before, the UK has just had 2 mild winters with lower flu deaths than normal, which could well have produced a bigger pool of “easy” CV19 older victims. Is CV19 also bringing forward deaths of older people who would have died within the next 2 years?
Bloody complicated to calculate and understand whilst in the middle of it.
To get some perspective on numbers, watch a vid by ‘dollar vigilante’;- {find it on bitchute}, where the planet’s population is illustrated with a big pile of rice and one grain is the amount of covid cases. We shut the world economy for one grain of rice!
-dollar vigilante- posted april 30th, rice anology at start of video)
Doesn’t Japann show the limitations of this approach. I am not for 1 second knocking what you’ve done. Are you really modelling a poor response to the virus and additional deaths caused by it?
One thought from the Diamond Princess. Only 20% of those aboard were found to be infected. Seems very low if nobody aboard had any resistance at the start, so it seems likely that many did.
Perhaps from previous exposure to a virus sufficiently similar to promote the production of effective antibodies, but less virulent.
A bit like cow pox promoted immunity from smallpox.
If so, find the virus and you’ve found a vaccine.
Even without finding the virus, it would imply that we are a lot nearer herd immunity that the percentage of recovered cases would indicate.
Also we don’t know what the overlap between those 250000 and normal mortality over the year will be.
I feel like this is the most interesting and pertinent discussion that no body is having. Perhaps because scientists have no idea but it seems very strange that when you look at all the different repsonses that countries are taking, no country has yet recorded a death rate that we are assured the virus is capable of. Why are all the log graphs for deaths flattening off before lock downs are even in place?
Studies in Germany, Iceland and California have the same independant conclusions, the death rate is 0.1-0.2% , so 0.6% is a circularly argued incorrect inflated number. An age distribution amended forecast for the US from the DP figures had it at 0.12%.
The US has 8 ‘swedens’. Take out NY and NJ and its death rate per million is about the same as Canada and not much more than Denmark.
Lockdowns were imposed after peak infection and peak hospitalisation, almost everywhere.
Everyone is modelling a failed strategy, not the virus, which go the way of every coronavirus before it.
John Church
If I’ve understood correctly your chart shows that the modelled mortality rate (via DP and Lombardy data) correlates with the average (median?) age of countries’ populations. If you did the same calculation using the all-cause death rate for the age bands in each country, you’d presumably find a similar relationship (essentially countries with older populations tend to have higher mortality rates).
This fits with an observation made several weeks ago by David Spiegelhalter that the variation of C-19 mortality rate with age is very similar to that of all-age mortality. It seems as though C-19 multiplies the mortality rate for all ages by a similar factor.
“no country has yet recorded a death rate that we are assured the virus is capable of” That’s much the same point as my own bewilderment that the CCP should shut down China over this virus.
It makes me wonder whether the virus did escape from a research lab, with the guilty scientists then terrifying the CCP with their tale of the harm it might do. If that is the case, and I have no idea whether it is, it may be that the worst prognostications of the hypothetical scientists won’t come about without a bit of mutation of the virus.
Another possibility was that the ruling cadre in the CCP took fright because it was people their age who were most at risk.
One other factor that one would have to chuck in to the mix is the overall health of a given population, not just its age. Its quite apparent that people who are overweight and/or have diabetes in some form are particularly vulnerable to CV-19, especially middle aged men. Thus two populations of identical age structure will have different death rates if one has low obesity rates and another has high ones.
My feeling is we are seeing in Western nations the poor basic underlying health of a significant proportion of the population impacting their chances of surviving the being infected. We all know that obesity is rising in western nations, as is type 2 diabetes. I doubt that such analysis would ever be done, its too politically unacceptable, but one would be interested to see data on the BMIs and diabetic status of sub 60 year old victims, or of the hospitalised cases. I suspect their BMIs would be higher than those who survive, and would be far more likely to be diabetic.
The trouble is that medical science has managed to save us from our own folly of obesity, heart disease and diabetic problems, and thus people can largely do as they please, and get everyone else (via socialised healthcare) to take their problem away. Maybe this virus is telling us that the individual is the only person who can improve their physical health, and if you shirk that responsibility the individual will bear the consequences.
Another factor (possibly among many) are the effects of temperature. Most Corona viruses – colds & flu – become less active in warmer weather.
The lower figures from India could be partially due to this, as there are reports of CV19 also being less infectious in warmer countries.
Africa, for now on the uphill curve, will soon produce figures which may show this.
Not sure what the studies you mention are … can you reference them ?
Looking at London, even being conservative and assuming 25% of UK deaths are from there, that would mean 7000 deaths out of a population of 8.9mln. That’s close to 0.1% of the total population if we assume everyone the city has already been infected, which won’t be true. And people are still passing away every day.
Indeed Japan seems to have a very low death rate to what might be expected from the model. Possibly genetic (much lower BMI’s etc). But what I suspect is that they have had very low transmission due to their early measures and the fact that wearing face masks is a national pre-occupation. Time will tell.
British Columbia may turn out to be interesting, they shut down travel before spring break, unlike Ontario. So no returning vacationers from US and Mexico and school trips. Vancouver did host the most recent Rugby 7s event at the start of March, over 70,000 over the weekend (so as some came both days say 40,000 people) in a stadium with the roof closed, yet there was no rash of cases reported with that being the common factor. Compare that with a dental conference at the same time where a foreign visitor was responsible for an outbreak that affected multiple provinces.
Ontario has just over twice the population but 10 times as many deaths. Both failed to lockdown the care homes though and it’s spread there has accounted for over 80% of BC deaths, still interesting to consider the difference
I am curious as to why the virus seems to fizzle out everywhere long before 60% of a population has been infected. Even in the densely-populated global infection hotspot of NYC, serological studies showed that around 25% of the population would have been infected. It has been demonstrated that in almost every location that implemented lockdowns, based on date of peak deaths, peak infections (followed by immediate decline) must have been several days before the lockdowns began, and this holds true for NYC. So something other than lockdown caused the virus to slow down LONG before 60% of people there became infected. I think the Infection Fatality Rate is under 1% there (probably one of the highest IFRs of any location I would guess).
My son was living in Hiroshima until a week ago. Life there was very normal. Older Japanese are a healthy lot, very low obesity and they don’t use ACE-inhibitors, they get pnuemonia jabs on the state every year. Also very low BAME population.
Dearieme: “That’s much the same point as my own bewilderment that the CCP should shut down China over this virus.”
We should be careful not to let our distaste for the rulers of the CCP blind us to their competence — far above the competence of our own petty bureaucrats and spineless politicians.
Whether C-19 was pre-existing, accidental, or deliberate, the rulers of the CCP saw the opportunity and seized it. By shutting down parts of China, they took some losses but established a pattern of behavior which the empty-headed followers of fashion in the West would want to ape. The lock-downs do much more damage to the financialized economies of the West than to the productive manufacturing economy of China. There will be long-term consequences!
In the meantime, we in the West are obsessing over death rates which are, in the great sweep of history, relatively minor. C-19 is nothing like the Spanish flu which killed 50,000,000 worldwide, mostly working individuals in the prime of life. At the same time,we are ignoring the huge economic impacts from the unnecessary lockdowns — impacts that may indeed change the course of history.
China’s CCP leadership have never forgiven the English for the Opium Wars, nor the Japanese for Manchuria. Is C-19 the first step in a planned revenge?
Heinsberg in Germany, Iceland have conducted a country-wide survey, and Stamford/SoCal in California.
“It makes me wonder whether the virus did escape from a research lab, with the guilty scientists then terrifying the CCP with their tale of the harm it might do”
That is my reading of the situation. New virus turns up, initially they pooh-pooh it, discipline those trying to get the word out etc. Things escalate, authorities can no longer ignore, investigate, realise that it has escaped from the lab 20 miles down the road. Scientists tell lurid tales of what it might do, authorities go full on 1984 lockdown mode, scared witless. But make the crucial decision NOT to suspend international flights out of Wuhan to ensure the West gets it good and hard too.
I don’t buy the idea that the CCP would intentionally infect its own people in order to then infect the West and steal a march on it, but I do think when faced with a choice of ‘This has happened, do we fess up and take the hit ourselves, or lie through our teeth and ensure everyone else gets it too, thus giving us a geo-political advantage as the first country in/out?’ they would hang the rest of the world out to dry in an instant.
%wearing face masks is a national preoccupation.
In Japan we don’t shake hands when we meet either; we bow;
we wash our hands when we get home every night and gargle;
we have a bath every night;
we are used to wearing face masks for flu every winter.
we are taught from an early age not touch our faces.
Japanese doctors are trained not to test for infection when morbidity rates are low because of the risk of generating false positives, and to circumvent the panic that would induce.
It’s possible that a lot of people are natural epidemiological dead ends: capable of being infected, but incapable of passing it on; perhaps because their immune systems deal with it so effectively.
New studies suggest that young children fall into this category. They can get infected, but there’s no evidence of them infecting anyone else.
Indeed. Hence I posit the existence of another virus, similar enough to produce immunity but far less dangerous than C19.
Herd immunity would be gained when 60% (if that is the figure) have had either C19 or the other virus.
Much as the cow pox virus provides immunity from smallpox.
I think these charts are interesting and note a ICFR of 0.24 being used.
https://twitter.com/EthicalSkeptic/status/1256017740437086208
https://twitter.com/EthicalSkeptic/status/1256020179743637505
I had a look at these .. as I could find them. Overall don’t see huge discrepancy.
Maybe I’m wrong, but it seems in both the German and US cases they did antibody surveys and then just estimated the mortality by dividing the total infections into the deaths. No problem with that, but we know that not all the deaths have occurred. as there is a lag of up to 6 weeks between getting infected and dying. You need to estimate what the ultimate deaths might be from the number of infections at that time. If you assume more deaths are going to happen based on the shape of the deaths curve, the mortality will increase upwards to what my model predicts (0.51 for USA and 0.76 for Germany).
For Iceland there have been 10 deaths so far. If we look at their profile we could estimate maybe another 5 and using a number of 15 with an average mortality of 0.47% from the model (for Iceland) tells you 0.9% of the population has been infected. Very similar to their estimate of 0.8%
In a simple SIR model, the herd immunity proportion is 1-1/R. So if your social distancing measures reduce R, the herd immunity level also comes down. R=2.5 gives 60% of the herd; R=2 gives 50%, R=1.5 and it’s 33%, and at R=1.25 it’s just 20%.
Yes, almost a perfect fit. Damned clever this virus. Or its almost as if everyone was dying of something they already had….
Don’t think its anything to do with social distancing, which no-one can prove reduces R. Its probably because the veracity of this virus is less than first assumed, the 1.25 might be the right number.
Plots of 2017/8 winter flu season in Europe have similar pattern. The volume under the curve of cv-19 and the flu is similar, cv-19 peaks a bit higher but is narrower.
I have yet to see any substantive evidence that the death rate overall exceeds a bad seasonal flu year.
Great observation and am absolutely sure we don’t know everything we need to. Just wondering if the rate of infection spread would slow down naturally as more and more people get infected ? Especially if a lockdown is thrown into the mix. Will be very interesting to see how Sweden’s infection levels continue to ‘mature’.
Also I can’t help feeling (something we will find out later) that the use of masks has an absolutely huge impact on reducing transmission. It would be somewhat tragic if it turns out all we needed to do was make some masks … instead of impoverishing a generation.
Annecdotal, but we had a wave of flu-type illness sweep through early January, one week half over half my office of 15 people was home. I would imagine at that time any deaths would have been put down to seasonal flu as no one was looking for Covid. Increasingly looking like Covid arrived earlier than thought so possibly either a milder version (or similar enough to confer some immunity) or even the full version, but at flu-type mortality rates didn’t ring any alarm bells
There were many reports of mild flu-like symptoms in January, so maybe we all had CV19 and didn’t realise it.
All the empirical evidence suggest lock-downs should be relaxed ASAP, now it’s increasingly obvious they’re causing more harm than good.
Just read something very interesting. A strong correlation between Covid deaths and Vitamin D deficiency. Now sure if this will bear out …. but might certainly explain and Japanese anomaly. They eat a LOT of fish.
In the rather favorable environment (for viral transmission) of a ship (Diamond Princess or aircraft carrier), the evidence shows that 4 out of 5 people do not get infected by C-19. There is lots of room for questions about the nature of the testing, but one reasonable explanation is that 80% of the human race has a natural immunity to this coronavirus — whether that is innate, or due to prior exposure to one of the hundreds of other coronaviruses in the environment. And of course, the evidence also shows that the impact of C-19 on the vast majority of the unfortunate 20% is minimal.
By the standards of genuine pandemics, C-19 has been a giant failure. But it has allowed a greedy Political Class to put its boot on the necks of us peons. The sad part is that so many of us peons turn out to be masochists — Please, Mr. Bureaucrat, stomp harder on my neck!
Individual variation in susceptibility or exposure to SARS-CoV-2 lowers the herd immunity threshold
doi: https://doi.org/10.1101/2020.04.27.20081893
Abstract
As severe acute respiratory syndrome coronavirus 2 (SARS-CoV-2) spreads, the susceptible subpopulation is depleted causing the rate at which new cases occur to decline. Variation in individual susceptibility or exposure to infection exacerbates this effect. Individuals that are frailer, and therefore more susceptible or more exposed, have higher probabilities of being infected, depleting the susceptible subpopulation of those who are at higher risk of infection, and thus intensifying the deceleration in occurrence of new cases. Eventually, susceptible numbers become low enough to prevent epidemic growth or, in other words, herd immunity is attained. Although estimates vary, it is currently believed that herd immunity to SARS-CoV-2 requires 60-70% of the population to be immune. Here we show that variation in susceptibility or exposure to infection can reduce these estimates. Achieving accurate estimates of heterogeneity for SARS-CoV-2 is therefore of paramount importance in controlling the COVID-19 pandemic.
Comments are closed.