This article is by Simon Anthony, a one-time theoretical physicist.
Over the past couple of months many misleading or wrong statements have been made by the media about C-19. Unfortunately, a number of these errors haven’t been corrected and instead have been reiterated and amplified to the extent they’ve become established folklore, repeated without reflection or question. In this piece I’ll discuss a few of these rogue ersatz ‘facts’ and try to correct them.
Specifically, I’ve looked at erroneous statements or claims concerning the properties or predictions of models. SIR models are used for understanding how a contagious disease spreads through a population. They divide people into three categories: those who are Susceptible to becoming infected, those who are Infected and those who’ve Recovered from the infection (actually something of a euphemism as the category includes those who die. More precisely, it means people who’ve passed through the I category and been ‘Removed’ from the Susceptible category). Given the rates of spread and recovery, the model calculates how the number of people in each of the categories changes over time.
SIR models are simple and can be made more complicated and subtle. There are however certain properties and behaviours which are shared by all realistic models. I’ll discuss some of those features and the often incorrect claims which are made about them.
I should say that some of the myths aren’t obviously untrue. Unfortunately many people in the media have generally (with some honourable exceptions – John Lee in The Spectator comes to mind) haven’t taken the time and trouble to do the necessary thinking before writing about C-19. So I’ll try to explain clearly. If I fail, please point this out in the comments and I’ll have another go.
1: ‘R0 is the rate at which C-19 spreads’.
This is incorrect: R0 isn’t a rate (which would be in units of something per second or per day or week or other time interval); it’s a number. It’s the number of people infected by an ‘average’ carrier, not in some arbitrary time interval but over the period during which the carrier is infectious. It’s the ratio of the time during which a person is infectious to the average time it takes to infect one other person. Or the ratio of the rate at which the infection is passed on by a single person (infections per month say) to the rate at which a person recovers (recoveries per month).
2: ‘R0 is the single factor which controls C-19 infections’
This is incorrect: R0 is one factor in a product of three factors which together control the rate of new infections. Which factor is most important depends on how long the outbreak has been running.
The rate at which people become infected is the product of:
The rate at which the infection is passed on x the number of people who are infectious x the probability of meeting someone to infect.
The last factor is the ratio of the number of susceptible people in a population divided by the total population. The latter two factors change in the course of an outbreak – initially susceptible people become infected and then recover, first decreasing the number of susceptible and increasing the number of infected, then decreasing the number of infected and increasing the number of recovered. As these numbers change, so do the associated factors and their relative importance to each other and to R0.
3: ‘R0 must be less than 1 to end the epidemic’
This is incorrect. Two terms combine to give the rate at which the number of infected people changes: as some people become infected, others recover and are no longer infectious. When people become infected and recover at the same rate, the number of infected people doesn’t change.
The rate at which an infected person infects others is the product of the rate at which infection is passed on (call this B) x the probability of meeting a susceptible person (which is just the number of susceptible people divided by total population (S/P)).
If the rate at which an infected person recovers is C, then the recovery rate matches the infection rate when C = B x S /P, or B/C x S/P = 1. Back in item 1, I explained that R0 is infection rate per person/recovery rate per person which is just B/C. So recovery rate is the same as infection rate when S/P = 1/R0 – the susceptible fraction of the population is the inverse of R0. When the fraction is higher, the number of infections increases; lower, it decreases.
For example, if R0 were, say, 3, then when the susceptible fraction of the population is less than a third, the epidemic will fade. If higher than a third, the number of infections will grow until enough people have been infected so that remaining susceptible fraction falls to a third.
The condition R0 = 1 is special only at the very start of an outbreak when everyone is susceptible so the susceptible fraction of the population is also 1. If at the outset R0 = 1 (and it doesn’t change), the number of infections is guaranteed not to grow (the initial carrier passes it to just one person who passes it to just one person and so on – at any time there’s (at most) just one infected person).
If R0 is greater than 1, infection spreads and the susceptible fraction falls. At some point, the fraction falls below 1/R0 and the outbreak recedes. So an epidemic can end while R0 is still greater than 1. In fact, this is ‘normal’ for contagious diseases for which there is no vaccine. This is ‘herd immunity’ – enough of the population has recovered (and become immune) that the susceptible fraction is less than 1/R0 and is “protected”. It may be that C-19 will be brought under control in this way rather than by development of a vaccine.
Here’s an example for R0 = 1.2.
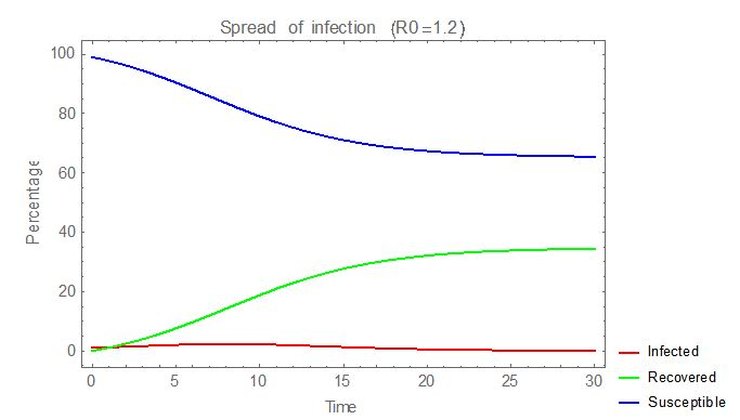
Herd immunity is present with ~35% of the population having been infected and recovered, ‘protecting’ the still susceptible 65%. Total mortality rate would be ~35% of the infection fatality rate.
In the early stages of the UK’s C-19 outbreak, R0 was estimated (by some) at ~3.5. Had it been allowed to run without check, this would have been the result:
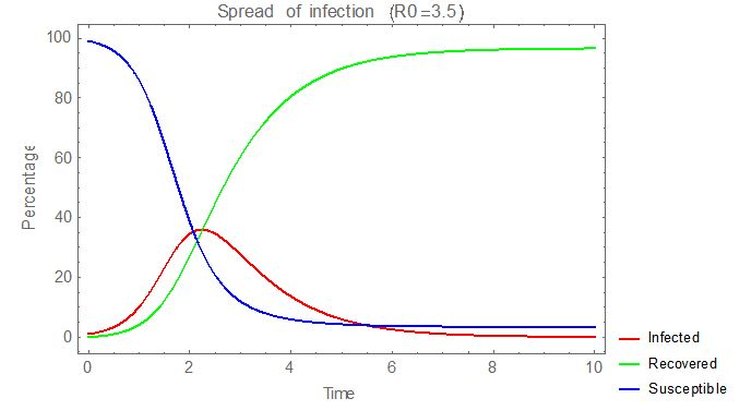
In this case, as only ~3% of the population would be uninfected, it’s misleading to call the final state ‘herd immunity’ as it’s so close to 100% individual immunity. Essentially everyone becomes infected and the mortality rate for the entire population would be the infection fatality rate, or about 3x that for an R0 of 1.2.
It seems likely that the UK government’s pre-lockdown policy was along the lines of hoping that, with the earlier voluntary distancing measures, R0 was just a little higher than 1 and CFR wasn’t much higher than for flu. Then something like the case above for R0=1.2 might have happened – herd immunity would have developed for a relatively low infected fraction and consequent mortality. But then it seemed as though R0 was much higher, with a much higher peak of infections and a CFR significantly higher than flu, leading to the imposition of lockdown. In contrast, Sweden seems to still believe that they’ve kept R0 at just over 1.
In a later post I’ll cover some misconceptions that have arisen concerning how lockdown and its removal might affect the spread of C-19.
Update: Housekeeping note from Hector: I have stopped the header menu being ‘sticky’ to prevent the issues with it some people were having.
16 thoughts on “Simon Anthony: Covid-19: Myths, misunderstandings and omissions”
Nicely explained. One of the things that frequently annoys me is seeing a herd immunity level of 60% being quoted as a gospel figure. It is of course no more that the level that applies if you can keep R at or below 2.5. Merkel was also wrong in her description of the supposed need to keep R below 1. As a chemist, she should know better, because many chemical reactions can have a similar behaviour: the rate of reaction depends on the remaining available concentration of the reactants, and an equilibrium can establish before a reaction goes to completion if there is some reaction in the reverse direction.
Keeping R low (= social distancing and “lockdown” measures, given a constant performance by the virus – which may change for other factors such as seasonal weather effects etc.) does speed up the rate at which any outbreak fizzles out, and also does reduce the numbers affected by any particular outbreak, assuming nothing is otherwise done to suppress it.
But if antibody tests show 20% of the population are immune, it means we can tolerate an R of up to 1.25 before risking an epidemic.
Of course, local situations will vary away from gross population averages. In crowded cities, the risk of transmission by infected people to the uninfected is much greater for any given level of local population immunity. By the same token, by the time the present epidemic wave has played out, city dwellers will have a higher level of exposure and thus herd immunity against a future recurrence. Isolated communities can remain very vulnerable – particularly care homes.
Even the infectiousness of individuals is a variable – some cough and splutter and otherwise spread the virus wherever they go, while others may pose little hazard if you get too close.
Given the unknown variables, it is actually a wonder that epidemiologists bother to try to predict at all at least in the early stages. There can be very little confidence in the numbers.
I think it it’s worthwhile trying to address misconceptions about this stuff, but I take issue with this:
“The condition R0 = 1 is special only at the very start of an outbreak when everyone is susceptible so the susceptible fraction of the population is also 1. If at the outset R0 = 1 (and it doesn’t change), ”
R0 itself only applies at the beginning of the outbreak. That’s what the zero signifies: it’s the reproduction number at the beginning of the outbreak while everyone is susceptible.
The condition “R0 = ANYTHING” is special only at the very start of an outbreak when everyone is susceptible.
There is a fairly clear explanation here:
https://www.cebm.net/covid-19/when-will-it-be-over-an-introduction-to-viral-reproduction-numbers-r0-and-re/
https://apple.news/AGZa7DArvQ9qJORJqEkDgfg
Neil Ferguson has resigned!!!
“Do as I say, Not as I do”
Neil Ferguson has resigned for being exposed – he allowed friends to visit him at home, how awful
Wonder how many on SAGE doing same
– Delingpole: The SAGE Committee Ruining Britain Is More Jeremy Corbyn Than Boris Johnson
“What was the point of voting Conservative in the last general election if the end result was for the country to be run by a committee largely comprising Corbynistas, Remainers, and other left-leaning ideologues?
And why isn’t the mainstream media kicking up more of a fuss about this grotesque betrayal of democracy?”
Delers spot on; it’s a disgrace
Sanity: Scathing attack on Govs and MSM Hysteria
Oxford-educated Prof. John Rao of St. John’s University in New York City has come out swinging against the “fraudulent” experts who counseled the shuttering of the world “for the sake of creating an antiseptic, barren, soulless world unfit for human beings to live in.”
He’s spot on
Good!
But if he hopes to avoid the inevitable opprobrium and blame for his useless software causing a panic reaction, he’s mistaken. Even if it takes a private prosecution, this fool must be brought to justice (and never believed again by anyone) – his idiotic pronouncements from his faulty computer model have (a) destroyed the economy and (b) killed many people due to misguided actions based on his advice.
The huge part missing from the SIR model formulation is that S is not equal to P for the C-19 population. In fact, S (the people Susceptible to catching the infection) is only about 20% of P, the total Population. We know this from the Diamond Princess and from other sources.
I detest our Betters’ expression “herd immunity” — we could not ask for a clearer encapsulation of how our rulers think about us peons. So let’s strike a small blow for freedom & respect and call it population immunity. If 60% population immunity is a magic figure, then let’s remember that we started with an 80% population immunity before C-19 was recognized (possibly because the virus or its very close cousins had been around long before C-19 was recognized). So the prospect of a genuine pandemic was never there. Much ado about very little.
Thanks for the comment and the link. The explanation in the link combines R0 and the susceptible fraction of people at any time into a time varying effective parameter Rt (or Re). While that’s fine and useful in practice, for explanatory purposes I think it’s clearer to keep the two separate – so R0 is constant and the susceptible fraction varies – because (provided there’s no mutation) R0 remains what it was at the start of the epidemic and what changes is the susceptible fraction.
Also, I think the link has an idealised view of how herd immunity is achieved in that it describes the “optimum” level – the minimum number of infections needed. However, due to “overshoot” this is almost always exceeded in practice, often by a large amount. I’ve written another post on “Lockdown myths” which discusses this point.
Very interesting – thanks. I note that this is how to model R(t). How does one go about working out what the effective R(t) is from data? I presume it’s not as simple as dividing one day’s death data by the previous day? That said, surely the number of cases on a given day is a product of the number of cases prior to it and the R(t) at that point, which means that there must be a direct link between the two?
It must be mostly complicated by the R(t) being a product of the infectiousness over time – so new cases (assuming that deaths are always the same proportion of new cases a certain time before),
Sorry got distracted and ran out of time. New cases aren’t a product of the previous day, but of the previous week(s) + a week to become symptomatic.
Not sure that is right. At 20% infections, there may have been sufficient people already immune to end the epidemic. That works if you take R as 1.25 in the environment of the cruise ship with everyone susceptible. Or if you assume R is higher, then there is probably a preexisting level of natural immunity that limits the numbers needed to achieve extinction of the epidemic with just 20% infections.
A couple of points:
– in practice there are usually more infections than needed for HI. e.g.,for R0 of 1.25, unmitigated, ~40% of the population is likely to be infected.
– infections on the Diamond Princess don’t seem to have reached a plateau. The data here…https://www.eurosurveillance.org/content/table/10.2807/1560-7917.ES.2020.25.10.2000180.t1?fmt=ahah&fullscreen=true …shows that the numbers (Number of individuals testing positive (cumulative)) seem to still be accelerating upwards on the day before the quarantine came to an end. The final day looks to be flattening but to assume that a plateau had been reached is putting a lot of weight on that single point.
Incidentally, the data shows that the number of individual cases went from ~10 to ~640 in ~16 days, doubling time of ~3 days. So if an infection is passed on every 3 days and infectiousness lasts for ~2 weeks, R0 (under cruise liner conditions) is ~4-5.
Roughly, but probably good enough, if you measure the number of infected people I(t) at intervals of, say, a day, and t is the number of days:
R(t) = I(t + 1)/I(t)
I have just seen comparative global data showing how Italians in ICUs are now recovering at 5x the rate of their British counterparts, and that this remarkable difference began appearing one week after the Italians authorised mass treatment with hydroxychloroquine (which is now being handed out free in pharmacies across Piedmont). States like Malaysia, Turkey, Israel, India and Morocco all apppear to have extremely low mortality rates and the pandemic contained, on account of adopting the same treatment early on and at mass scale. But our enemedia show no interest in investigating and verifying the many graphs and data posted by ‘Covid19Crusher’ on twitter, the most revealing I’ve seen. But can we trust this source?
I read a few articles about the fact that the number of contacts was not evenly spread – ie (say) 1/3 of people account for 2/3 of social contacts. The article says that none of the models incorporate this – they assume the same average number of contacts for everyone, but that it has very profound effects (downwards) on the proportion of the poupulation required for “Population Immunity” (dropping the H word as suggested above).
What I am not sure about is the extent to which this is accounted for / overlaps with the concept of “susceptibility”.
See, eg, https://marginalrevolution.com/marginalrevolution/2020/04/epidemiology-and-selection-problems.html
He’s an Oxford-educated historian, so I’m not inclined to place a large amount of weight on his assessment of whether or not expert epidemiologists are “fraudulent”.
Comments are closed.