Hard-working reader Christopher Bowyer has sent me some more graphs, some based on NHS England data, and some on the ONS week 18 release.
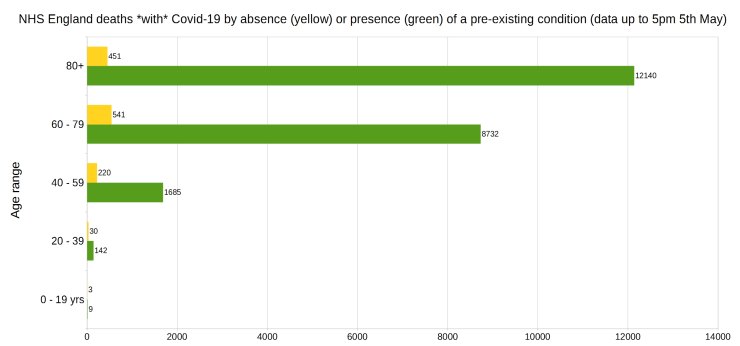
First, NHS England deaths with Covid-19 by absence (yellow) or presence (green) of a pre-existing condition.
Next, percentage of deaths with Covid-19 by pre-existing condition. (94.8% have one or more P.E.C.) Data from NHS England.
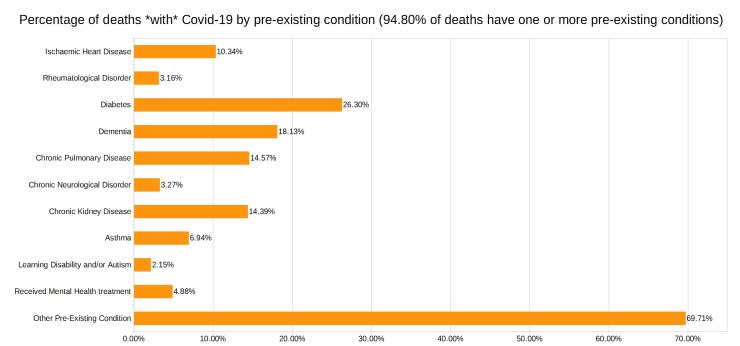
Note that the most common pre-existing conditions are diabetes, followed by dementia, chronic pulmonary disease, and chronic kidney disease.
Covid-19 deaths in England by date of death, with 3-day moving average trendline (the thicker line).
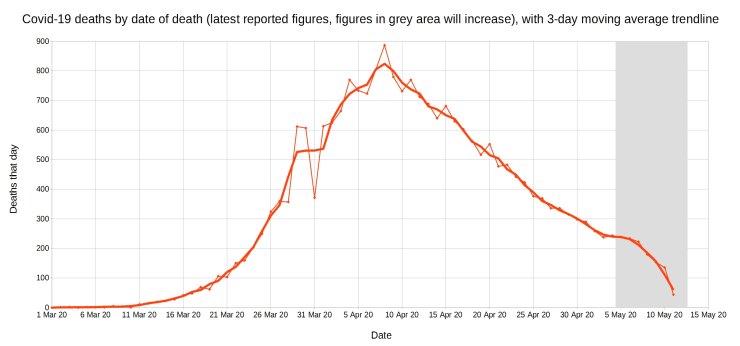
Note that numbers in grey area will increase over the next few days.
Covid-19 is dying out in England, yet the lockdown, and the thousands of lockdown deaths remain.
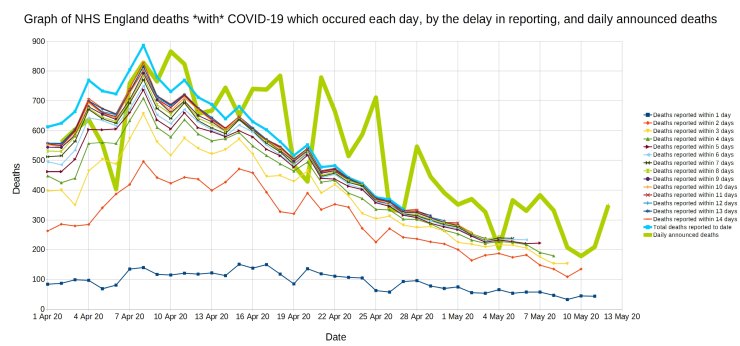
A graph of deaths with Covid-19 in England which occurred each day, by the delay in reporting. Thick line is overall daily announced deaths.
Trendlines (3-day average) for Covid-19 deaths by England NHS region, by date of death.
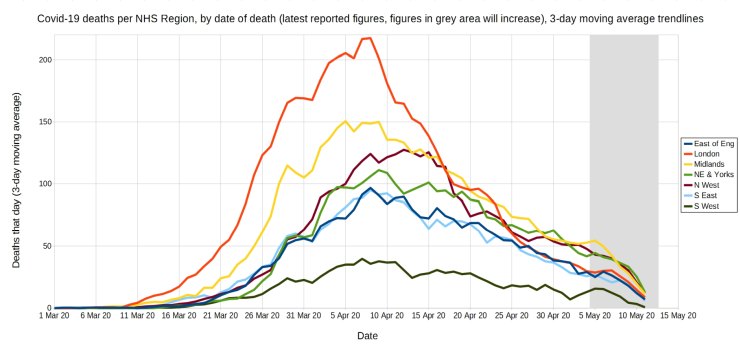
Note that the numbers in the grey area will increase over the next few days.
Trendlines (3-day average) for Covid-19 deaths per million by England NHS region, by date of death.
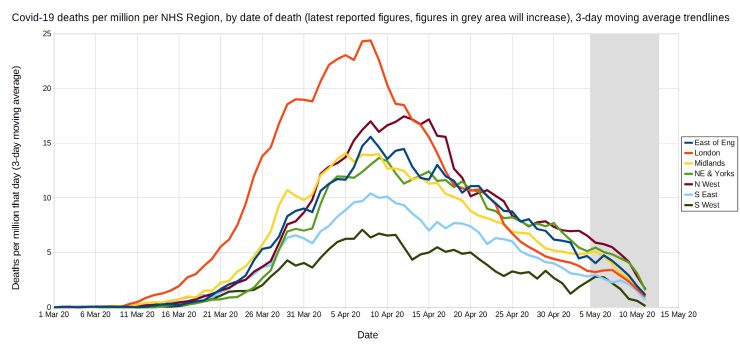
Note that the numbers in the grey area will increase over the next few days.
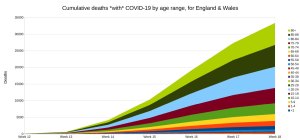
Weekly cumulative deaths with COVID-19, by age range (ONS data).

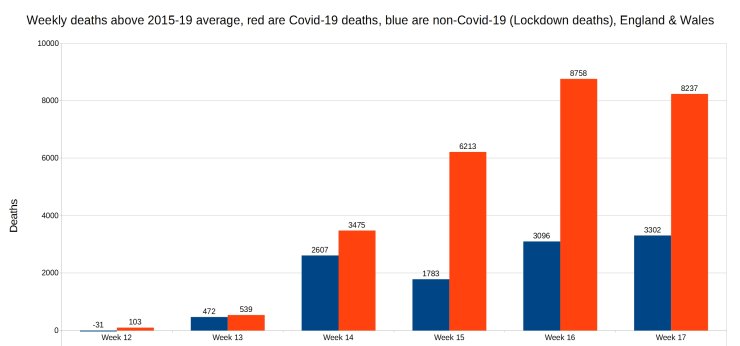
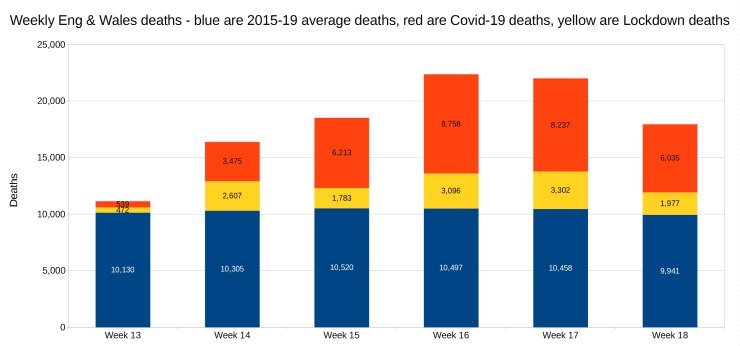
Weekly cumulative deaths above 2015-19 average, Covid (red) and non-Covid/lockdown (blue). ONS data.
Weekly deaths by category: five-year average (blue), Covid-19 (red), and non-Covid/lockdown (yellow). ONS data.
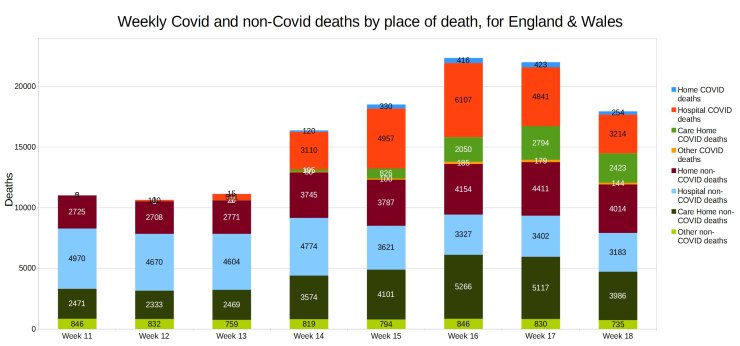
Weekly Covid and non-Covid deaths by place of death. ONS data.
Many thanks to Christopher for doing these.
20 thoughts on “Latest graphs from Christopher Bowyer”
I did some slightly different analysis much of which I reported in support of Simon Anthony’s article, looking at the age and sex structure of the ONS data. I’ve also started to have a look at care homes on a mapped basis:
https://datawrapper.dwcdn.net/1ulCP/1/
And I have added a last 7 day new cases map covering GB here:
https://datawrapper.dwcdn.net/URmRa/2/
Note that everywhere except Denbighshire falls below the German lockdown standard of 500 cases per million (50 per 100,000) in a week.
The date of death graphs are extremely useful yet appear in no government press conference nor any national newspaper. Why is that? And by the way, the note about figures in grey increasing over the next few days is entirely appropriate, however, as the number of cases diminish, the increase may be less than before.
England in more detail:
https://datawrapper.dwcdn.net/YIgji/1/
I’ve added an “implied R” by looking at the ratio of cases in the last week to the previous week. A highly simplified way of estimating it, but I think it has reasonable validity given the infectious behaviour of the disease, and using weekly data gets rid of the weekend effects too.
https://datawrapper.dwcdn.net/l1Hip/1/
@Chris
Thanks for the graphs, No 1 is very useful
@All
Why would dementia be an increased risk?
Any data for those on immunosuppressants (transplant receivers)?
NI stands out again: no excess deaths to date. I know large number of OrangeMen can’t be reason, anyone have plausible ideas?
Wales no excess this week, so far only two weeks with excess. Yet Eng & Scot excess continues. Very odd – ideas?
Dementia suffers tend to be older and in care homes, so maybe of itself not an increased risk, just a sign of overall conditions. If lots of people in care homes are at risk then dementia suffers are going to show up on the charts
and they are often on statins; statins make dementia more likely; and statins make people more prone to infections; that is well documented; and care home residents get no sun, and in studies have much lower Vit D levels: Vit D is key to keep good immunity; so a bit of a king-hit
“NI stands out again: no excess deaths to date. …. anyone have plausible ideas?”
In the days of gerrymandering, the phrase was “Vote Early, and Vote Often”.
Sadly, that sentiment is rather frowned upon these days, but that enterprising spirit remains; the NI defn of a corona death is reported as
“Individuals who have died within 28 days of first positive result, whether of not covid 19 was the cause of death”
so corona is the cause of death, even when not the cause of death.
There must be profound disappointment that despite this creative fluency, death rates have remained stubbornly low; this may lessen the chances of generous funding to an endlessly needy Province from an eternally generous UK Treasury.
Great charts. Thanks.
When you look at that cumulative deaths plot (the title picture), anyone with age less than 50 is hardly even visible on the plot. Makes a complete mockery of all the fear-mongering around getting primary schools restarted.
Quote of the Day
As the US always appears to be portrayed as the overweight capital of the world, how come only around 90,000 people there have died, from a population of 331 million, and the UK has nearly 35,000 dead from a population of 66 million? Yet another attempt by this utterly useless “government” to shift the blame away from their utterly useless headless chicken management style.
How many of the old who died were obese?
Christ, when will these people own up to their mistakes and desist from lying?
I am curious here John: you seem quite angry;
“to shift the blame away from their utterly useless headless chicken management style.”
So you would wish to blame the UK govt as the sole thing?
Ms. Platell was quoted: “The unavoidable truth is that a quarter of all people who have died from Covid-19 are overweight. Almost a third of British adults are now clinically obese …”
Help me with the arithmetic here. If 1 Brit in 3 is clinically obese (aka really really fat) but only 1 Brit in 4 who got the coveted “Died from C-19” Death Certificate was obese — does that not suggest that perhaps being obese might offer some degree of protection from the dreaded C-19?
Or might it suggest that Anti-Fat activists are seeing what they want to see?
Yep Gavin, correct and as I said ,yet another attempt to avoid being honest about this. What, because Johnson is considered “obese”, we should all pay heed?
The Health Gnome and others of his gang that caught it don’t seem too fat.
Sorry TT, yes I am angry. I’m angry at my fellow citizens for mostly being a bunch of spineless wimps who appear to believe anything that the blasted BBC and the rest of the mendacious, sensationalist bunch we call the MSM have told them.
I’m angry at the NHS and the way it’s either thrown out or ignored the really sick, in order to deal with the virus.
I’m angry at the BBC et al, for the above.
I’m angry at all the false prophets, the experts and the naysayers that have appeared to tell us just how bad this flu is and how many hundreds of thousands of us WILL die.
And yes, I’m angry at the so-called government, for lacking the balls to take charge of this thing right at the start and adopt a real, actual PLAN and stick to it.
Lastly (I can think of other things (don’t mention the clapping) about this I’m angry about, but I’m done for now) I’m angry at myself, for allowing myself to become involved in becoming angry about all of the above.
It’s the flu for Christ’s sake. The bloody flu. So we shut the whole f*****g country down for THIS.
Apologies for the intemperate language and any poor grammar.
Yep, her ignorance is astounding and two consecutive sentences contradicting each other is Ritchie like stupidity
National news outlets are also ignoring vital global data showing very clearly how the UK and France are failing dismally to stop the fatalities. Graph-lovers should enjoy Covid19Crusher on twitter, where a hugely more optimistic picture is revealed. Today’s taster: Ireland (pop. 4,930,999) reports 23,048 cases and 1,553 deaths. Singapore (pop. 5,844,763) has 28,038 cases and just 22 deaths. Both nations have had lockdowns, Singapore is famous as densely populated. What explains the extraordinary difference? Not the lockdowns, it would seem. However, although not officially authorised, doctors in Singapore have been making extensive and early use of hydroxychloroquine.
Maybe when they are forced to see the essential international and comparative data being ignored by the MSM and medical establishment but not by heroes like Covid19Crusher on twitter.
https://twitter.com/Covid19Crusher
Well said John.
Gov’t refusing to make their own decisions in best interests of all in country shows how pathetically weak they are. They’re putting emotion & panic above hard facts, logic and rationality
Luke Johnston was excellent on QT – he was rational and forthright in explaining risk, figurers, lockdown personal & economic damage, and other four on panel all state employees.
Didn’t go down well, rest scowl & ignore ‘cold hard facts’ with some bleating about “every death a tragedy; you want to kill people; can’t guarantee safe; wait for vaccine, blah”
Audience: “I don’t understand new message”
Labour & SNP: “Can’t end shutdown as people are dying; Gov’t must give precise advise/orders to everyone; go back to work if safe not clear enough”
BBC Question Time – 14 05 20
Luke Johnson “lockdown will kill more than the virus” and causes outrage for calling pandemic propaganda – ignored, FiFi moves on
https://www.youtube.com/watch?v=jW7I-J0Qyfs
Luke Johnson “lockdown was wrong” – ignored, FiFi moves on
https://youtu.be/Hjh_BO29cSo?t=1581
Luke Johnson “Shutdown worse than virus, public sector don’t care” – ignored, FiFi moves on
https://youtu.be/Hjh_BO29cSo?t=2109
Comments are closed.