New Covid-19 graphs from Christopher Bowyer. ONS data here (up to week 31, week ending 31 July). NHS England data here. Other Covid data here.
I haven’t said it for a while, so let me make clear that the use of this data to make graphs is not an endorsement of the accuracy of the data! As we have recently see, the government and the relevant civil service departments has been in a total muddle over the Covid figures.
If you’d like to see graphs that feature numbers from earlier in the year, go here.
All graphs can be clicked to enlarge.
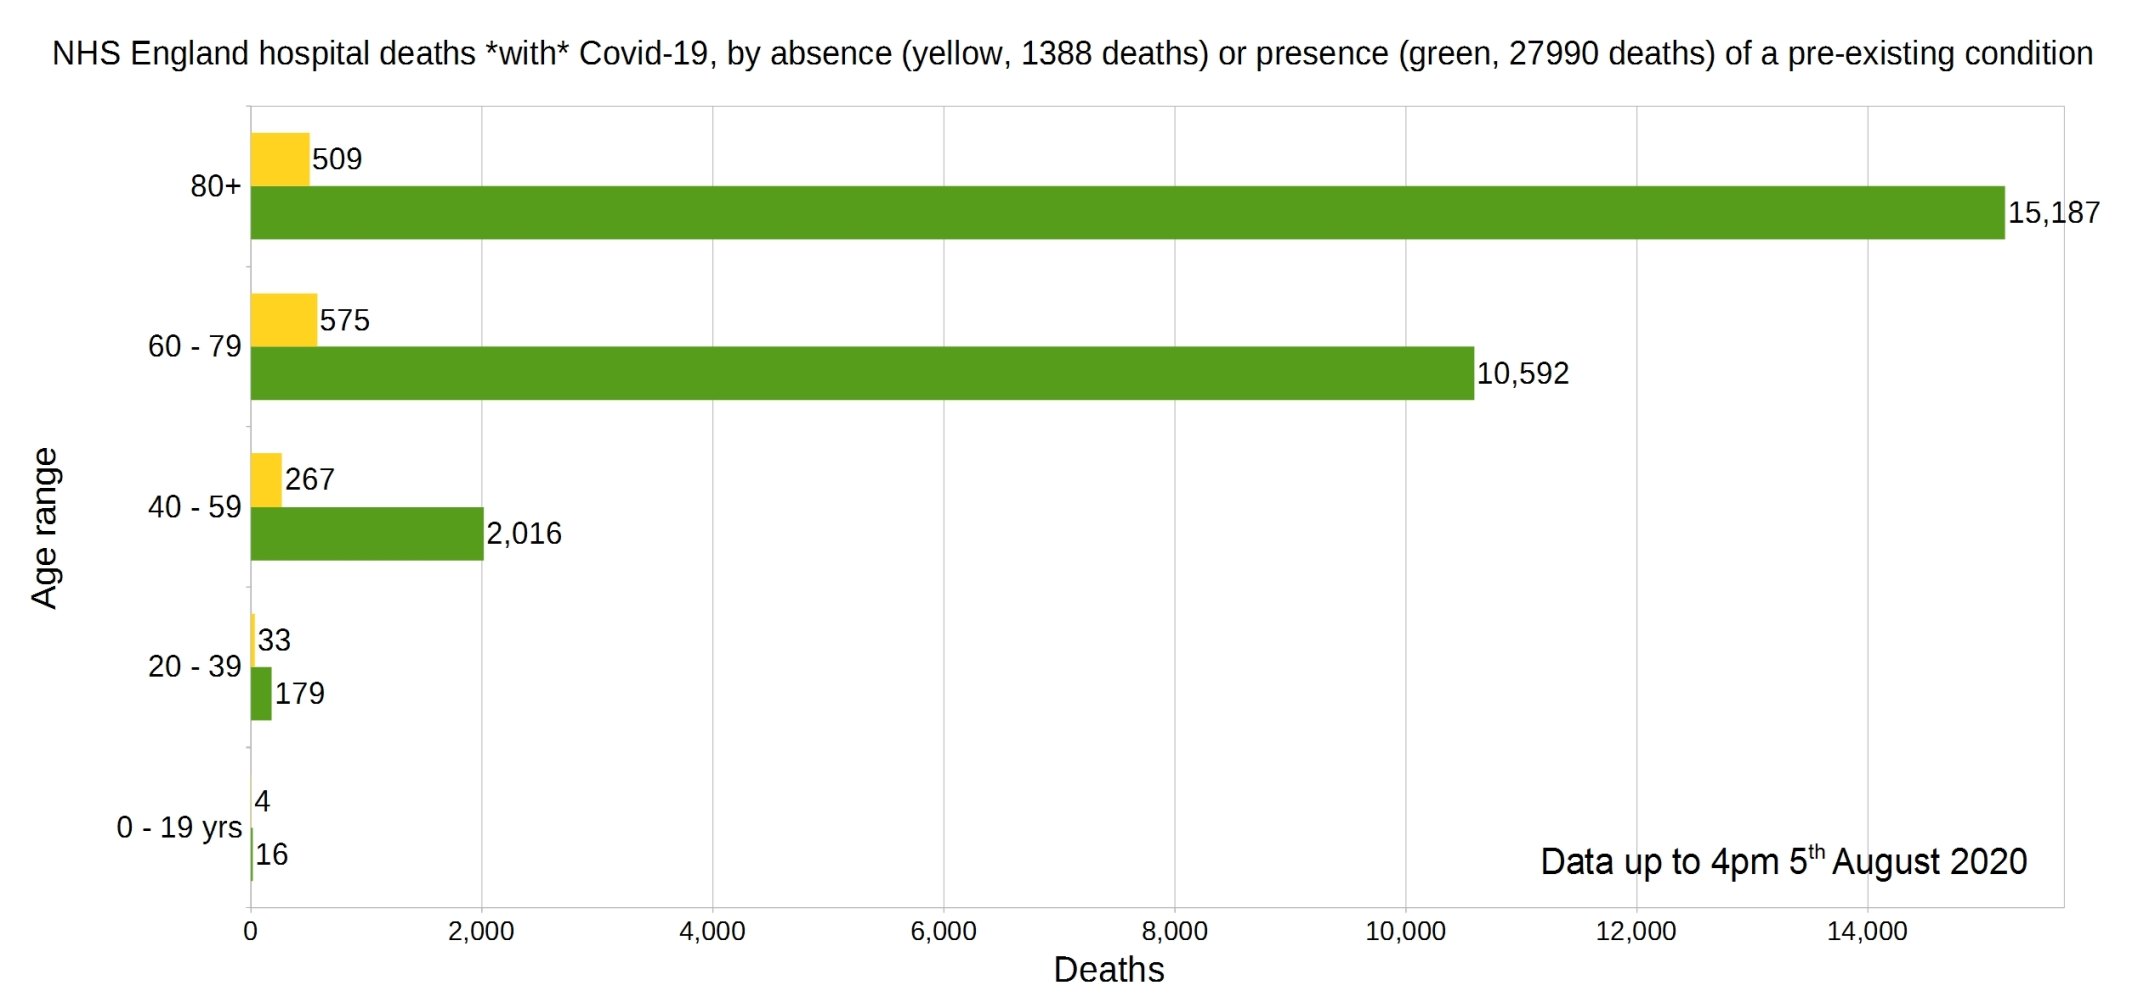
England deaths with Covid-19 by absence (yellow) or presence (green) of a pre-existing condition. Data from NHS England.
Percentage of deaths with Covid-19 by pre-existing condition. (95% have one or more P.E.C.) NHS England data.
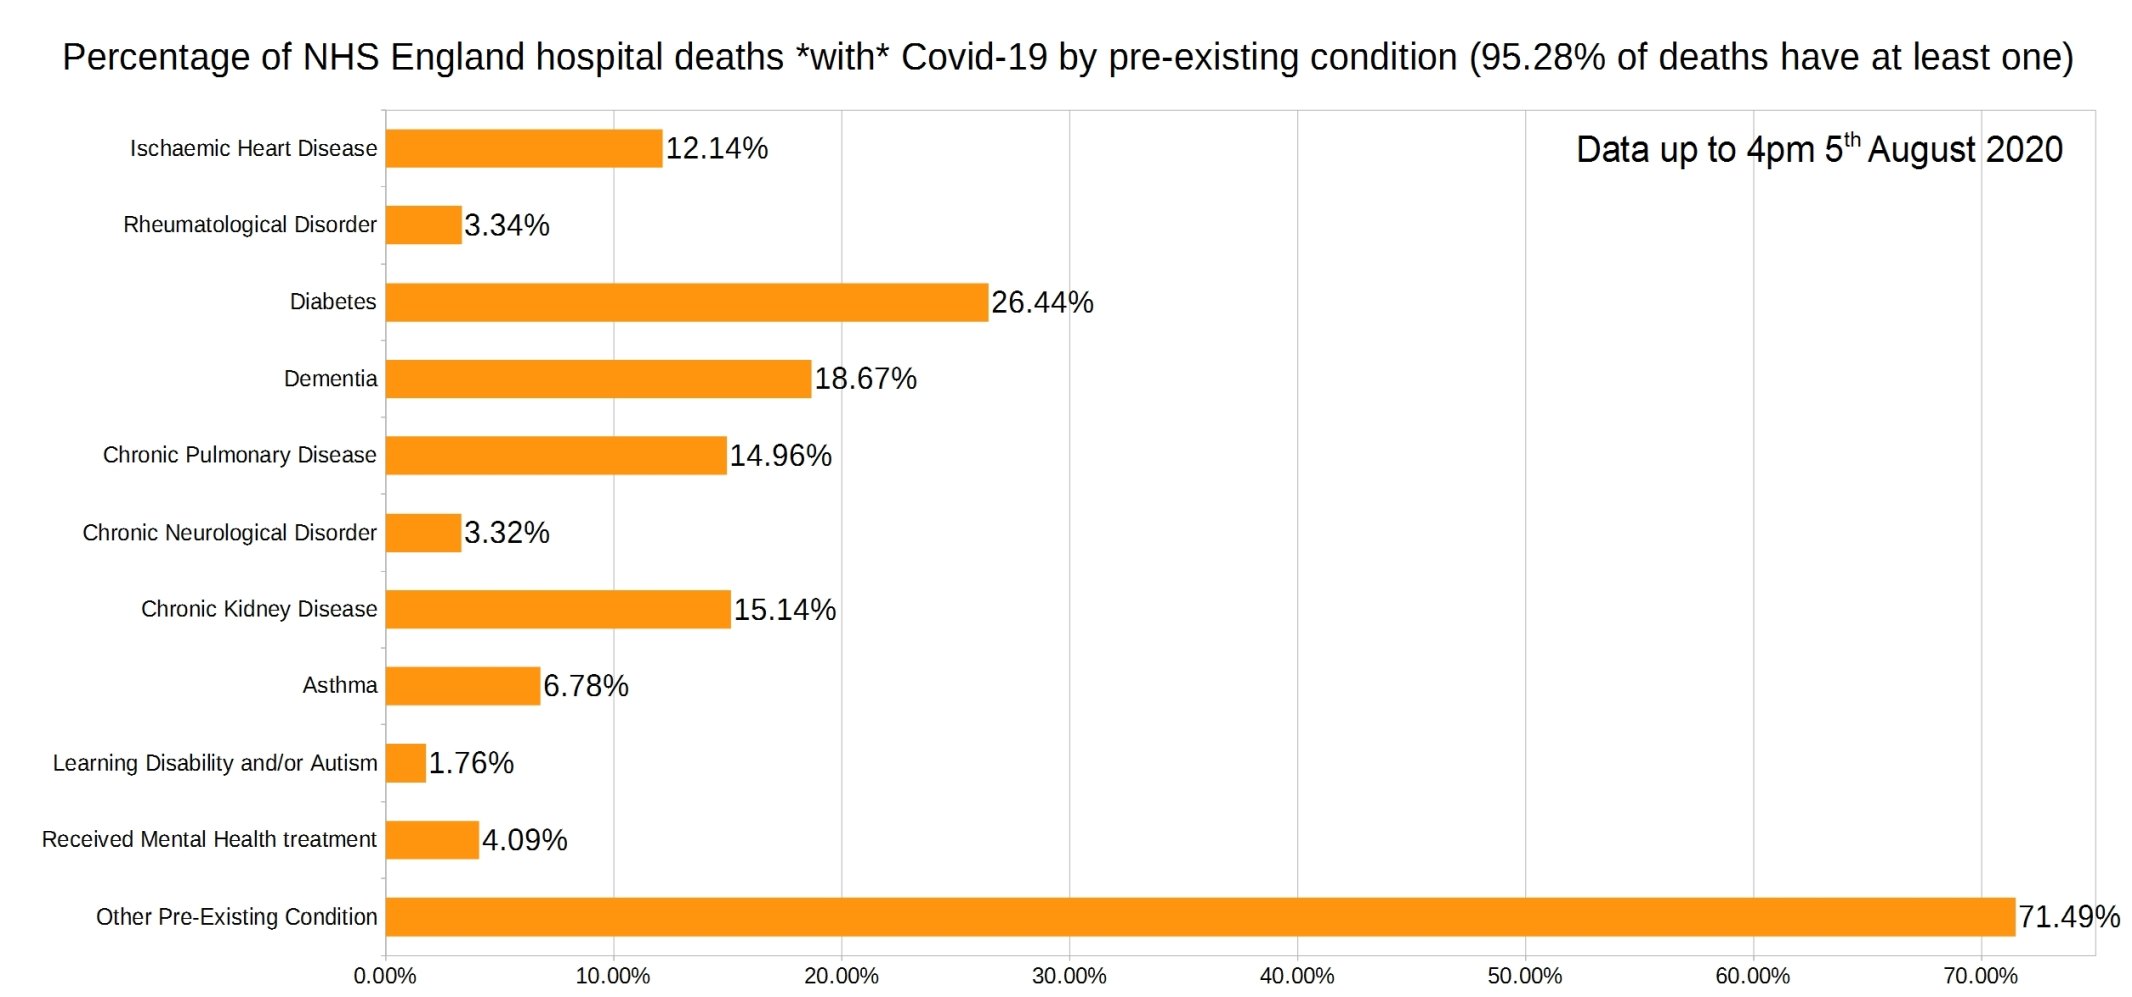
Note that the most common pre-existing conditions are diabetes, followed by dementia, chronic pulmonary disease, and chronic kidney disease.
A graph of deaths with Covid-19 in England which occurred each day, by the delay in reporting. Thick line is overall daily announced deaths. NHS England data.

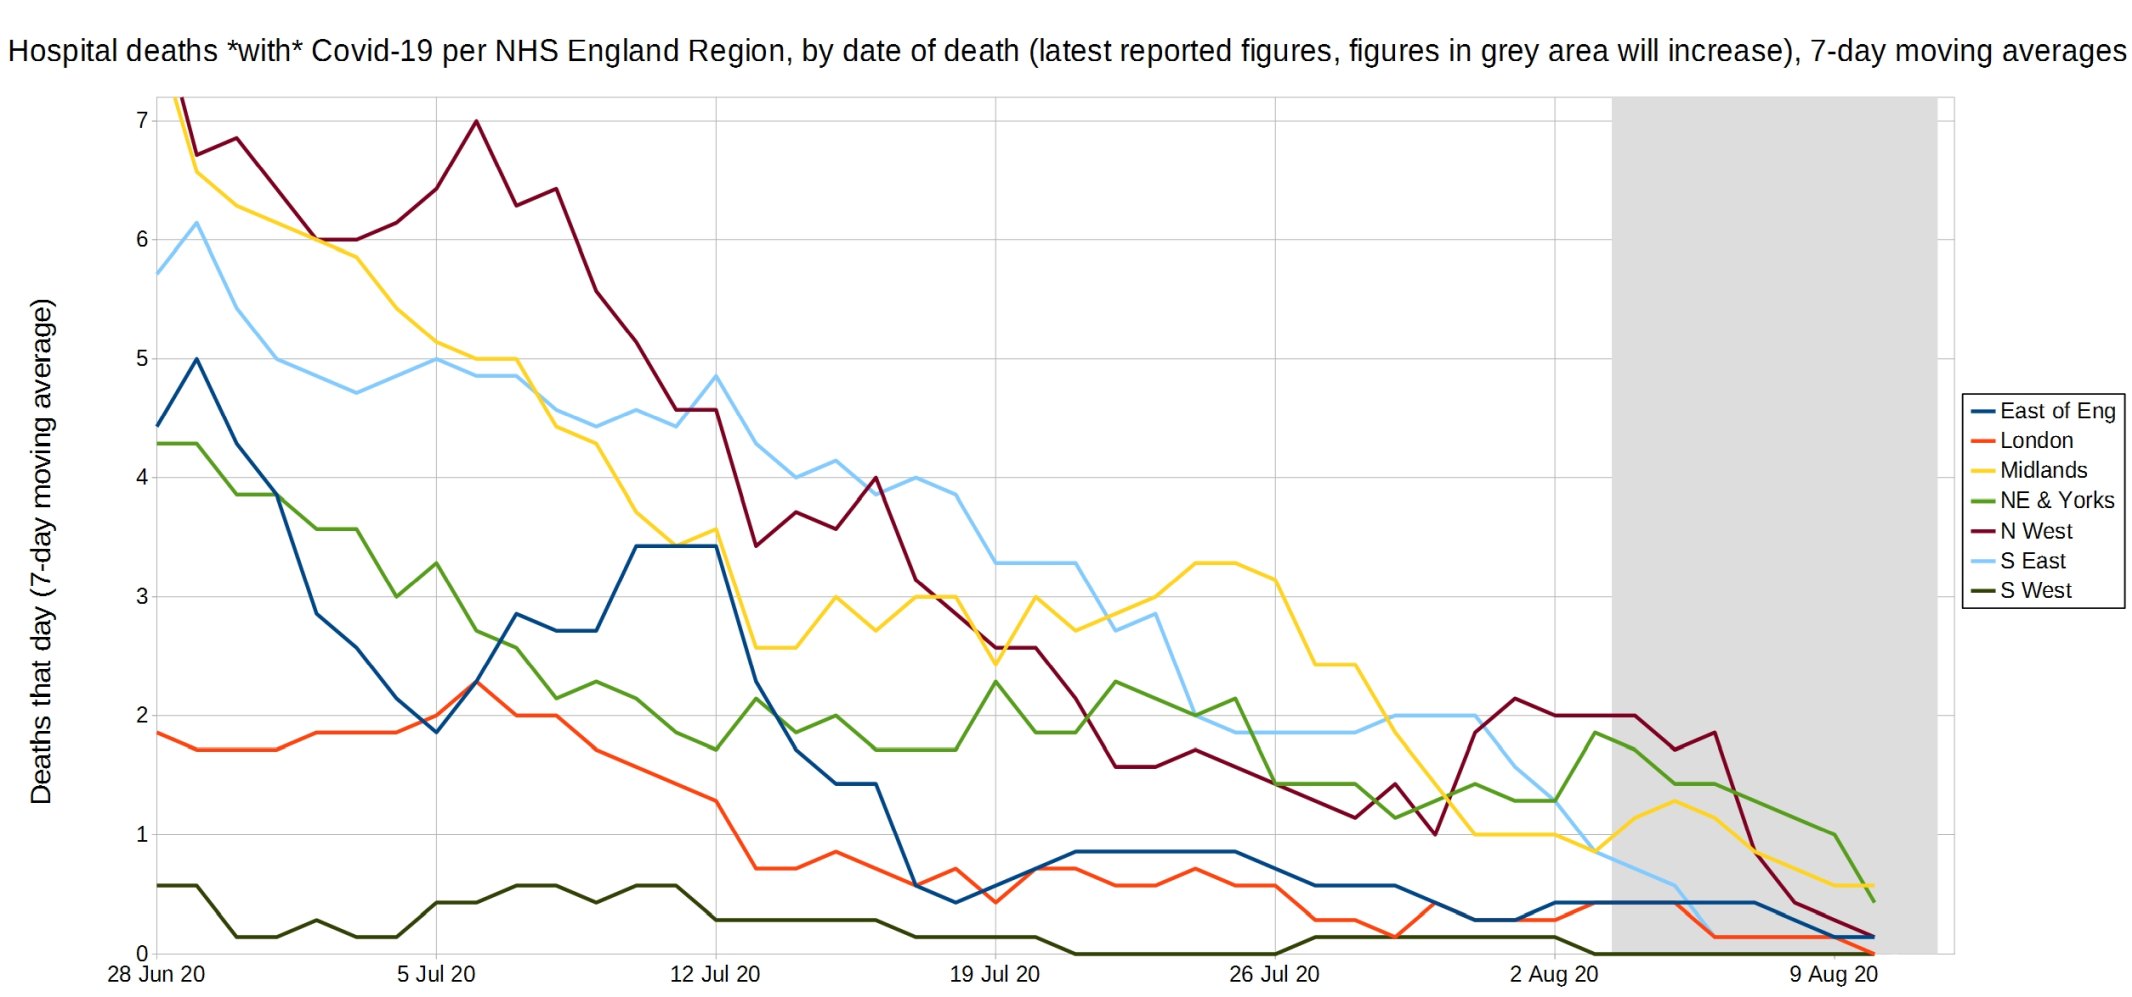
Trendlines (7-day average) for Covid-19 deaths by England NHS region, by date of death. (Note that the numbers in the grey area may increase over the next few days.) NHS England data.
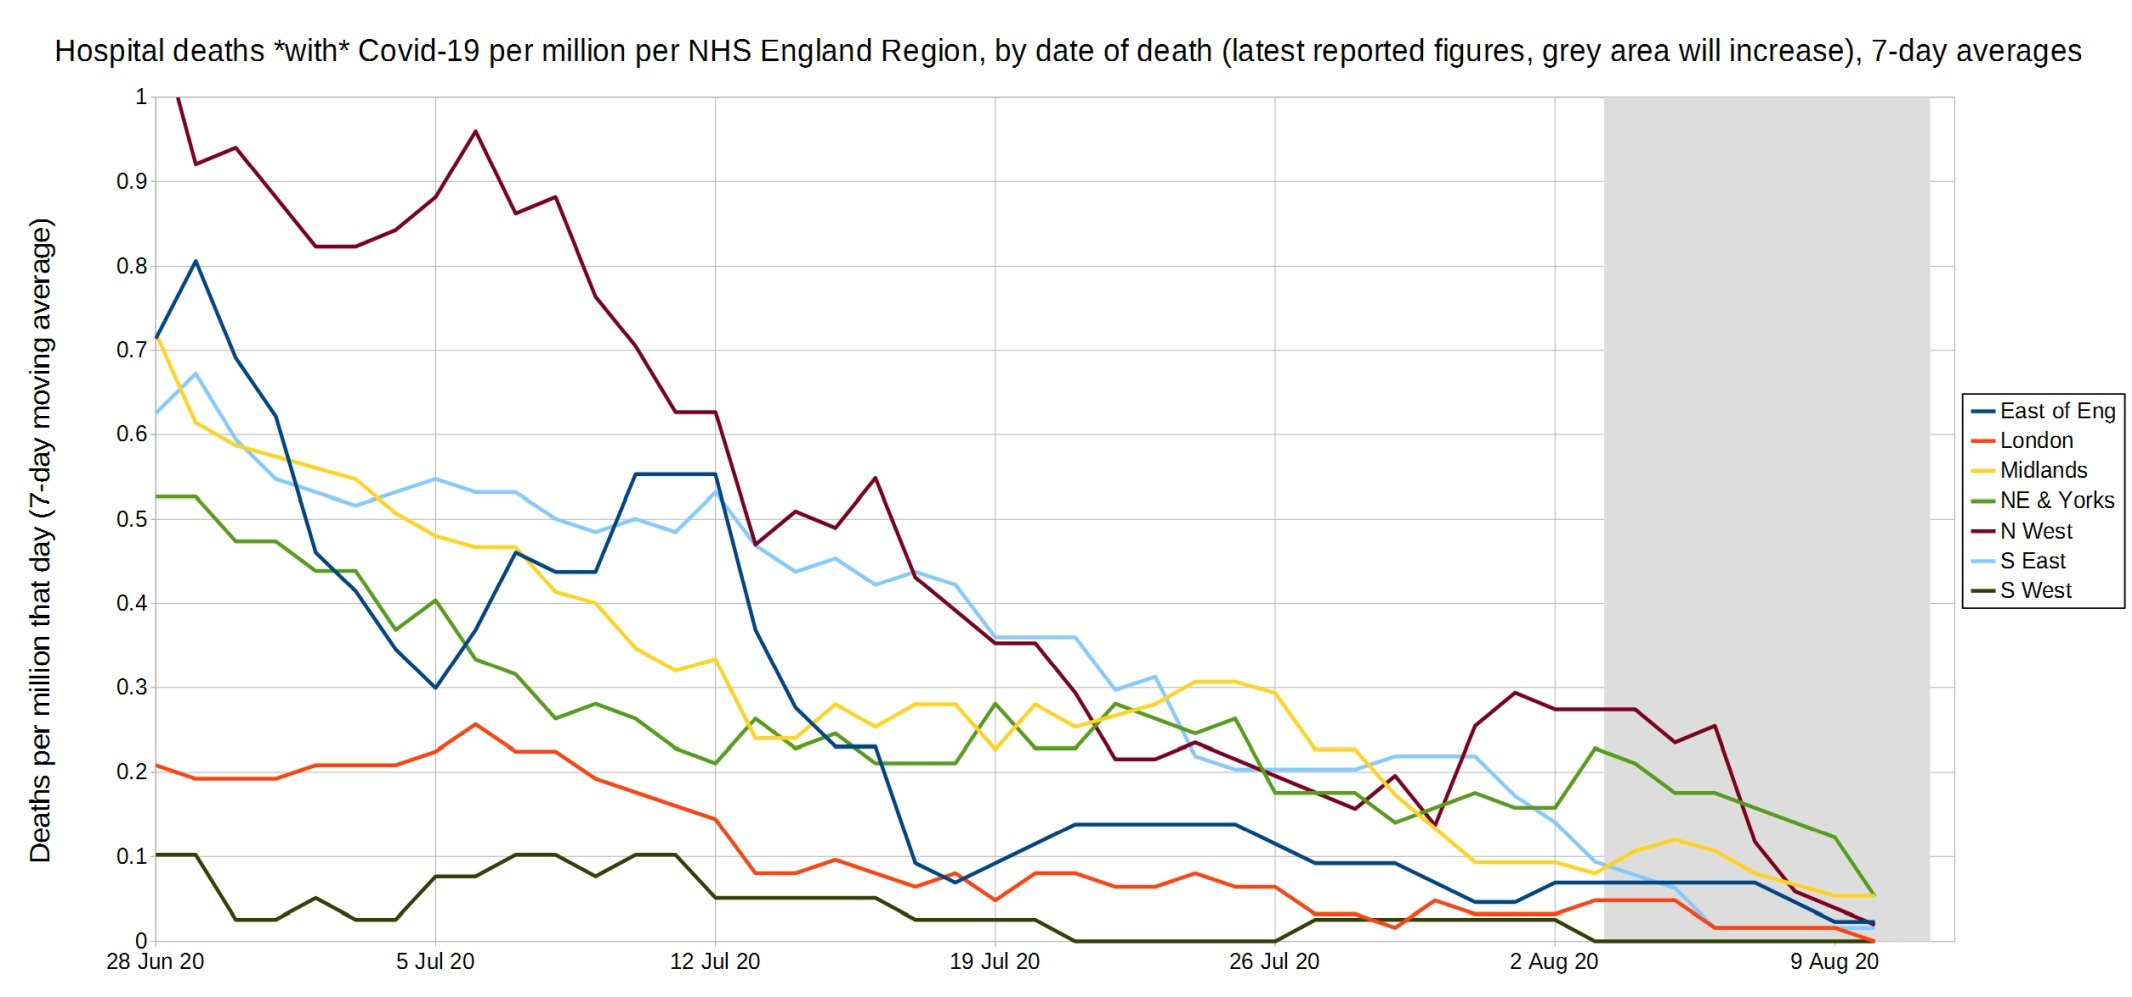
Trendlines (7-day average) for Covid-19 deaths per million by England NHS region, by date of death. (Note that the numbers in the grey area may increase over the next few days.) NHS England data.
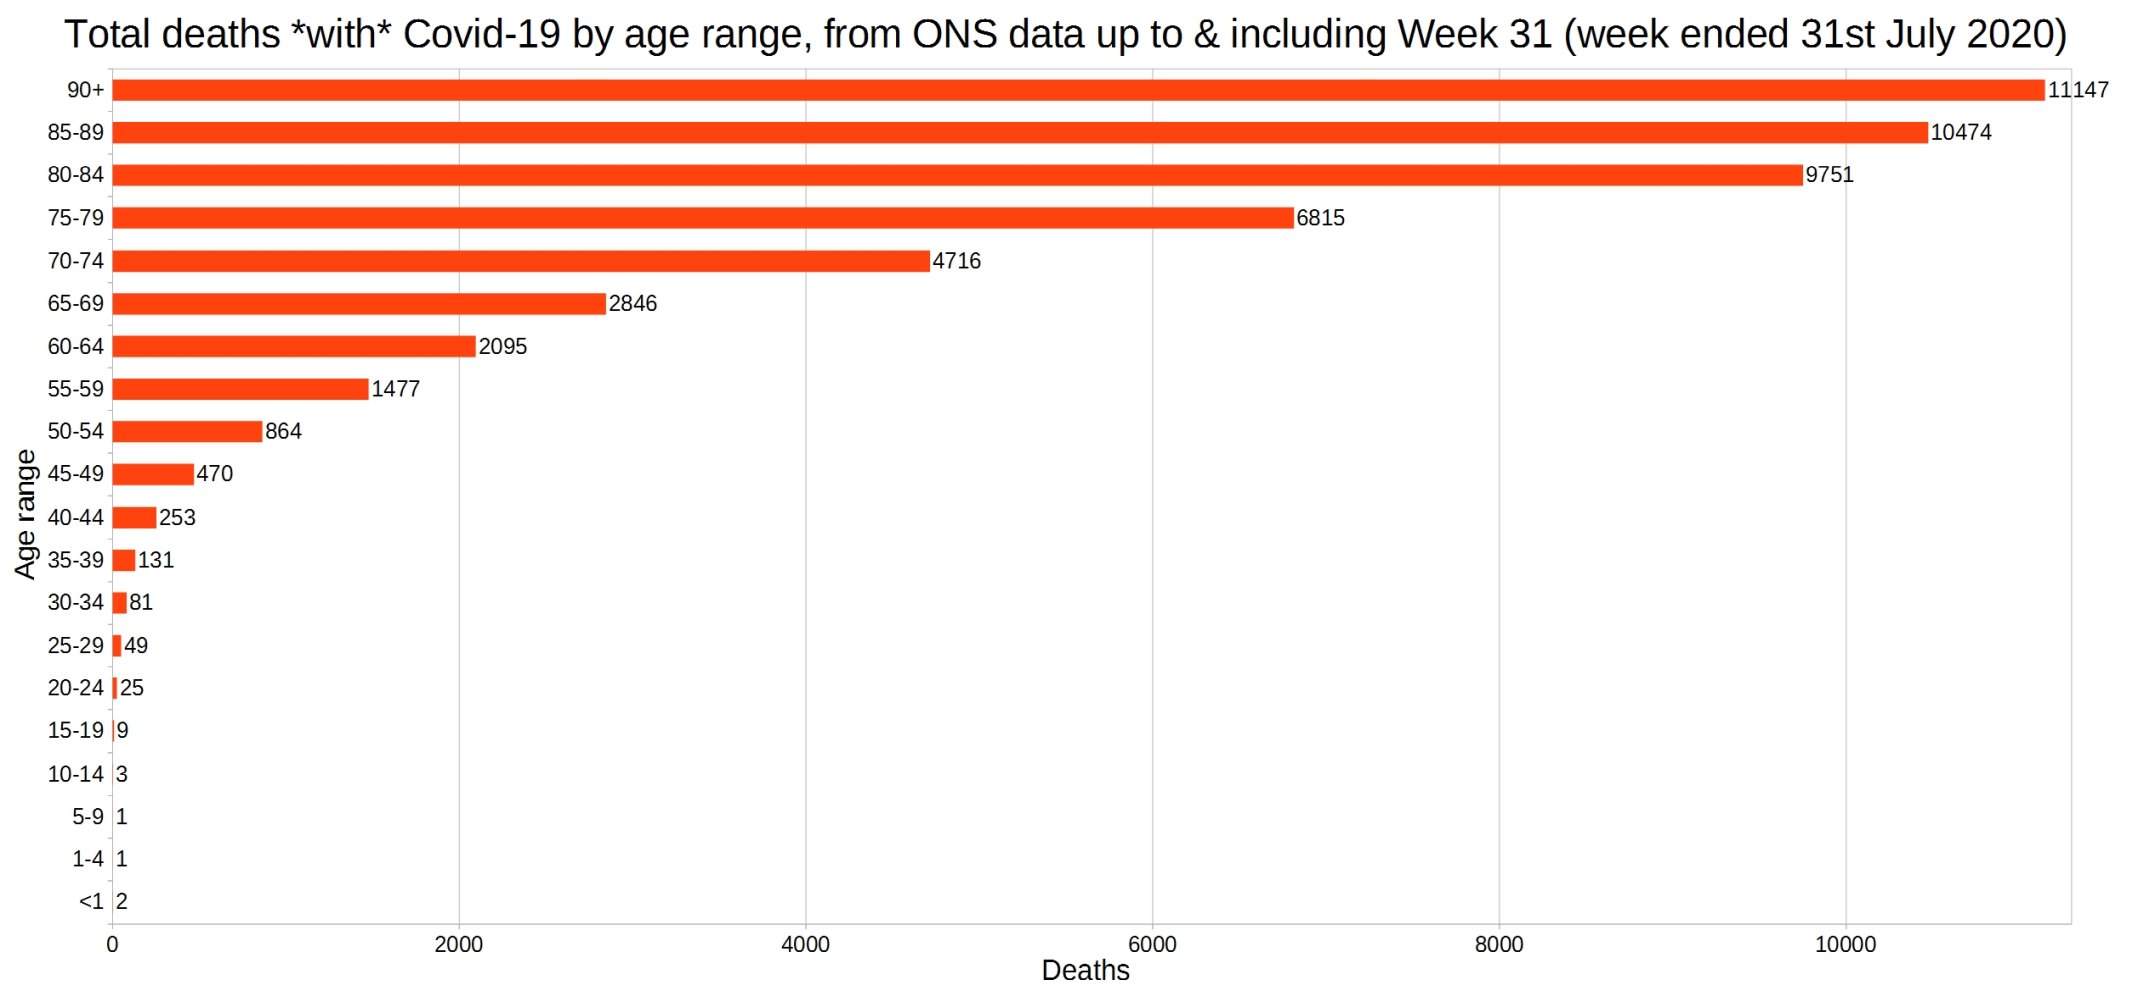
England and Wales total deaths with Covid-19, by detailed age range. ONS data.
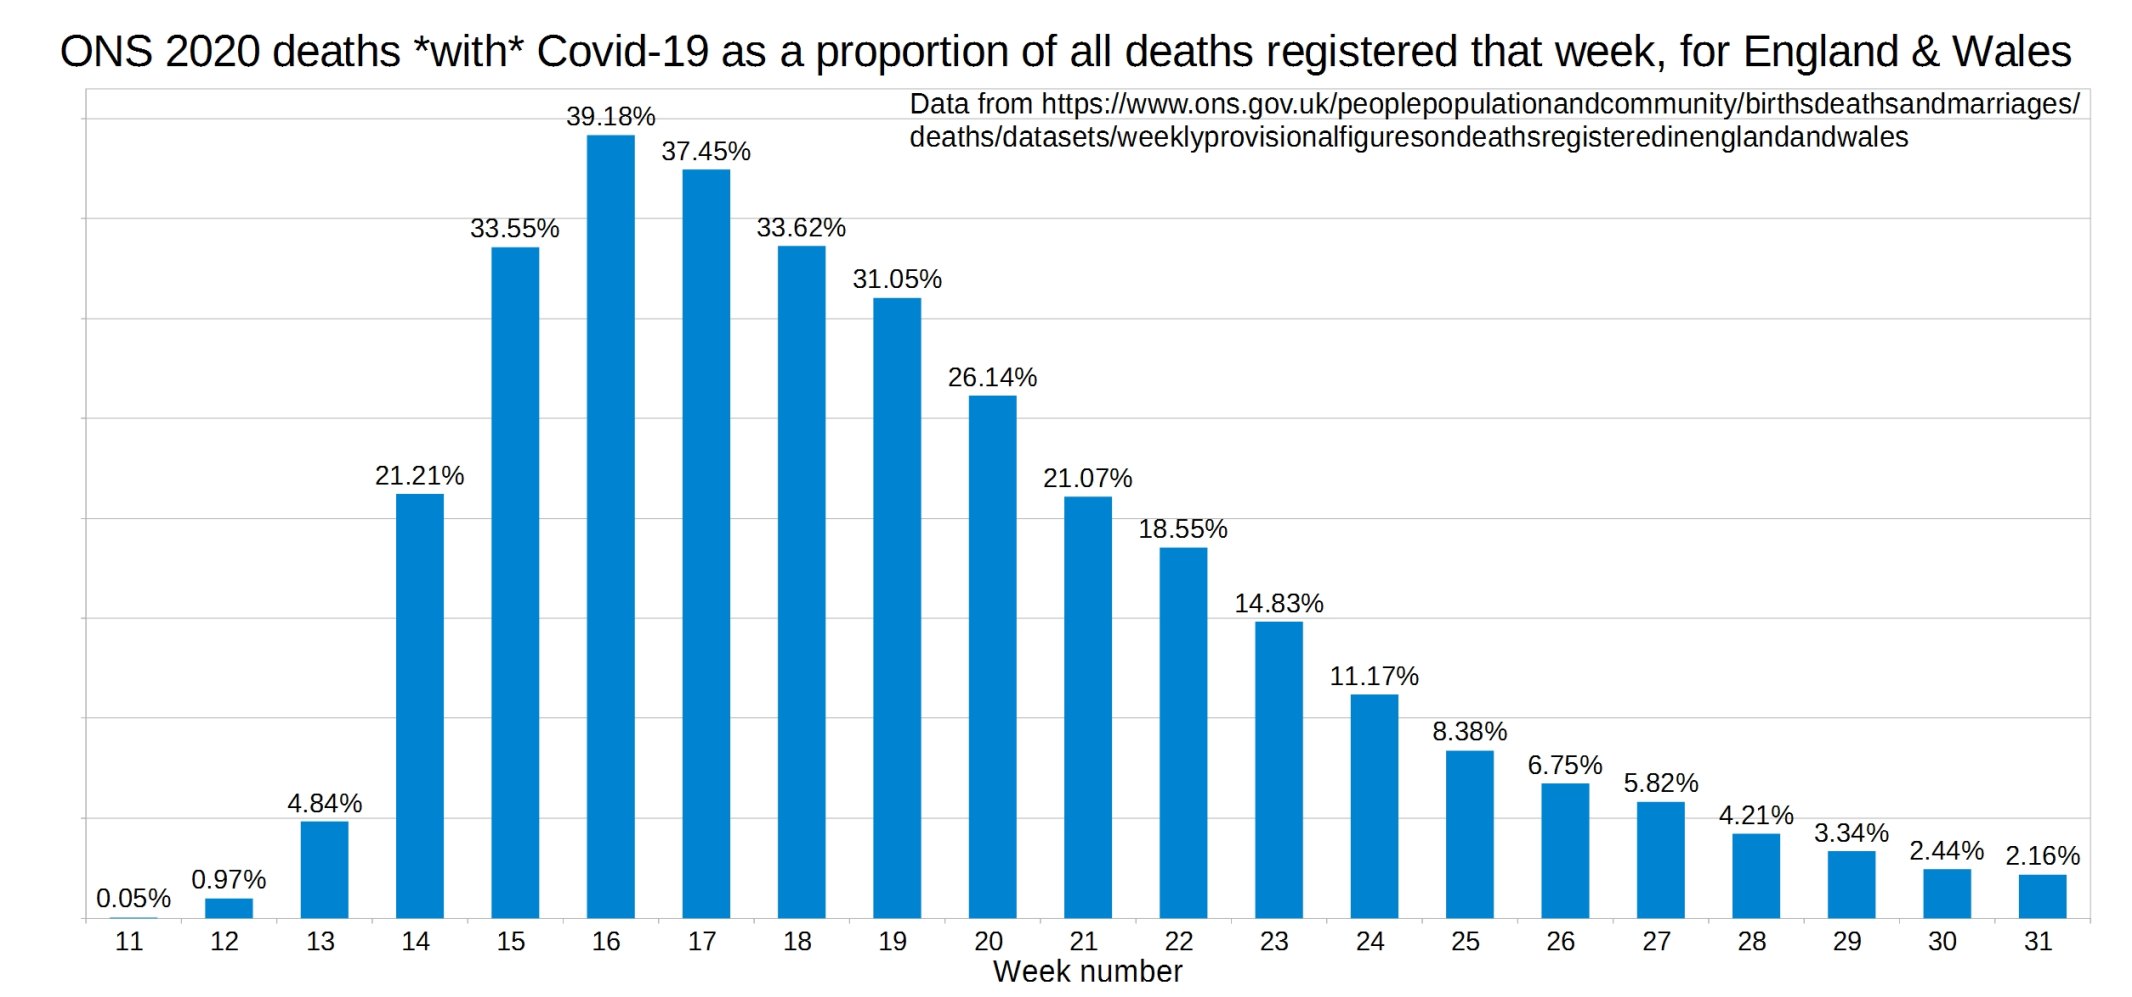
ONS England and Wales Covid-19 deaths as a proportion of all deaths registered that week.
ONS England and Wales weekly all-cause deaths compared with the five-year average.
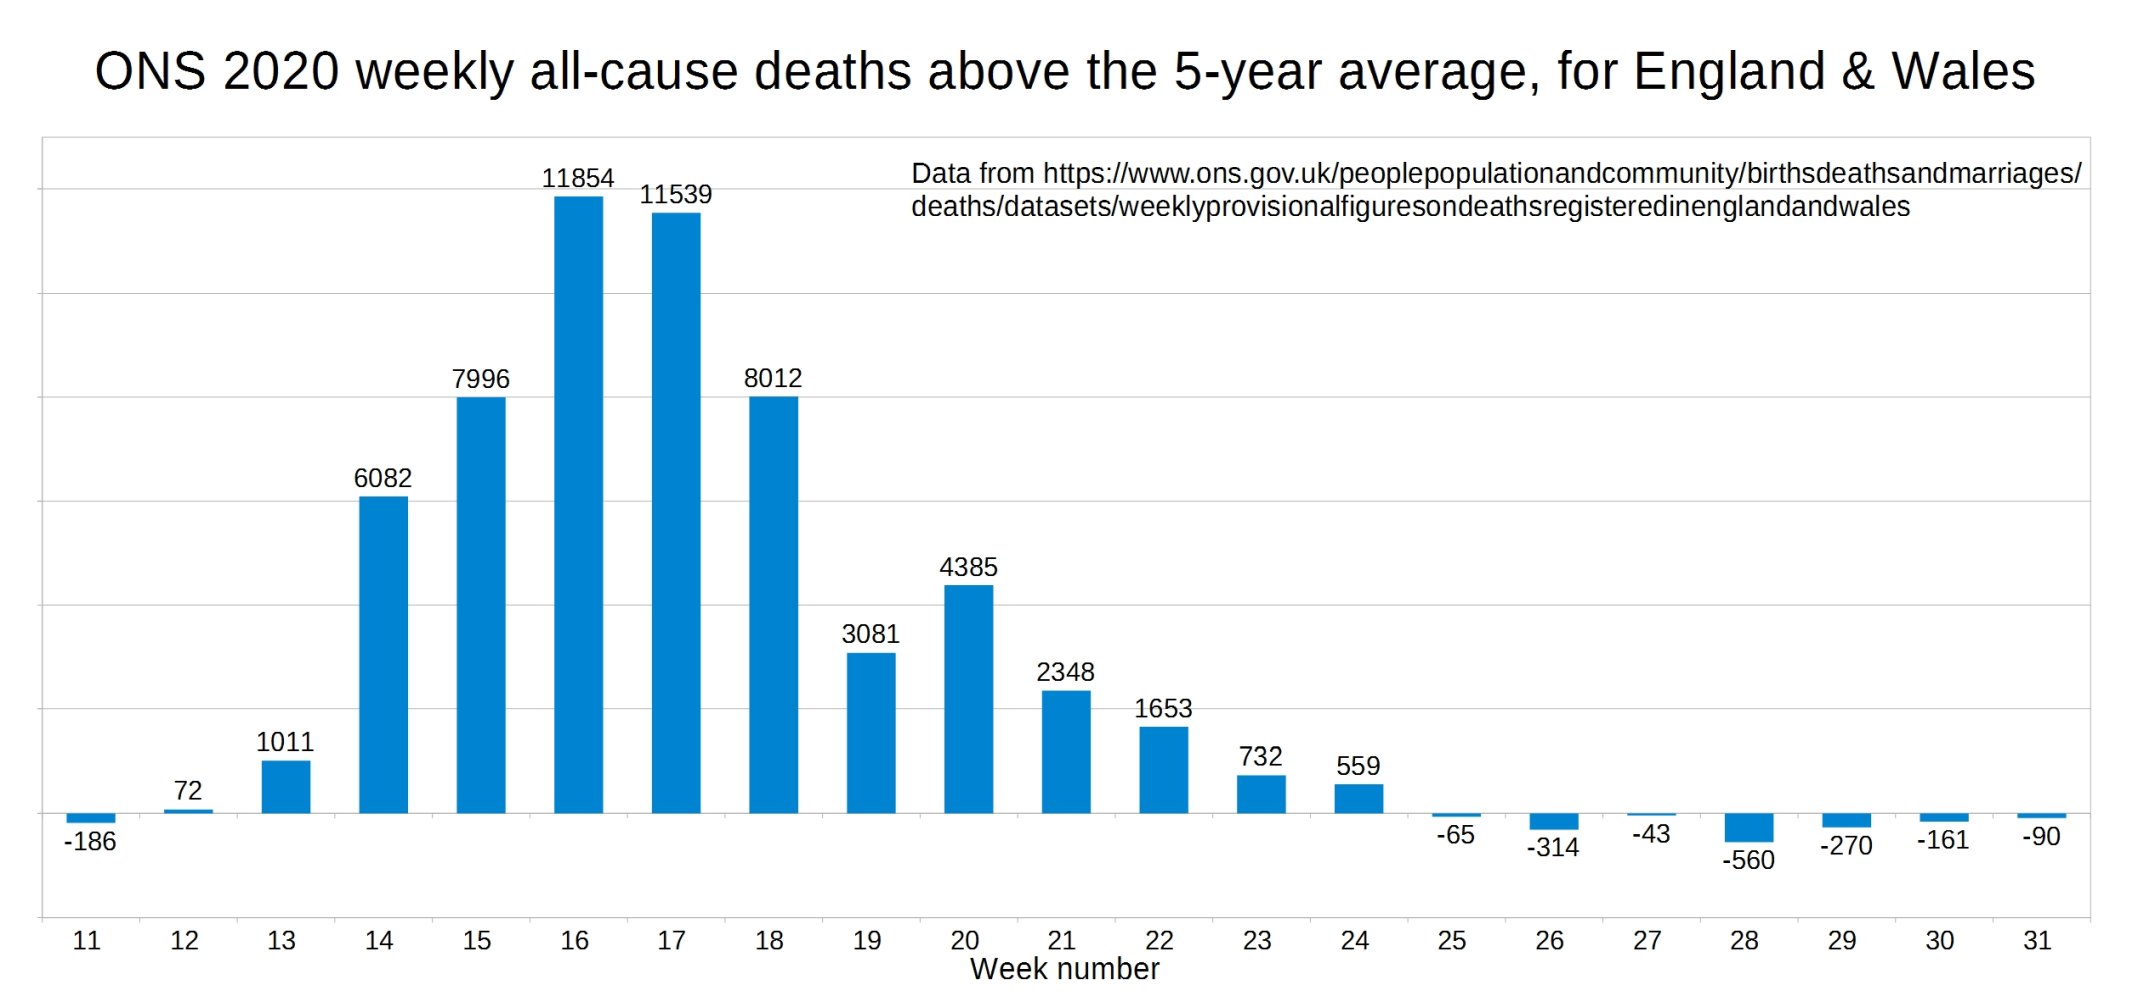
Note that we have now had seven weeks in a row of all-cause deaths being below the five-year average, which is, to say the least, somewhat peculiar seeing as we are supposedly undergoing a terrifying once-in-a-century killer pandemic ravaging the country and requiring society to be upended.
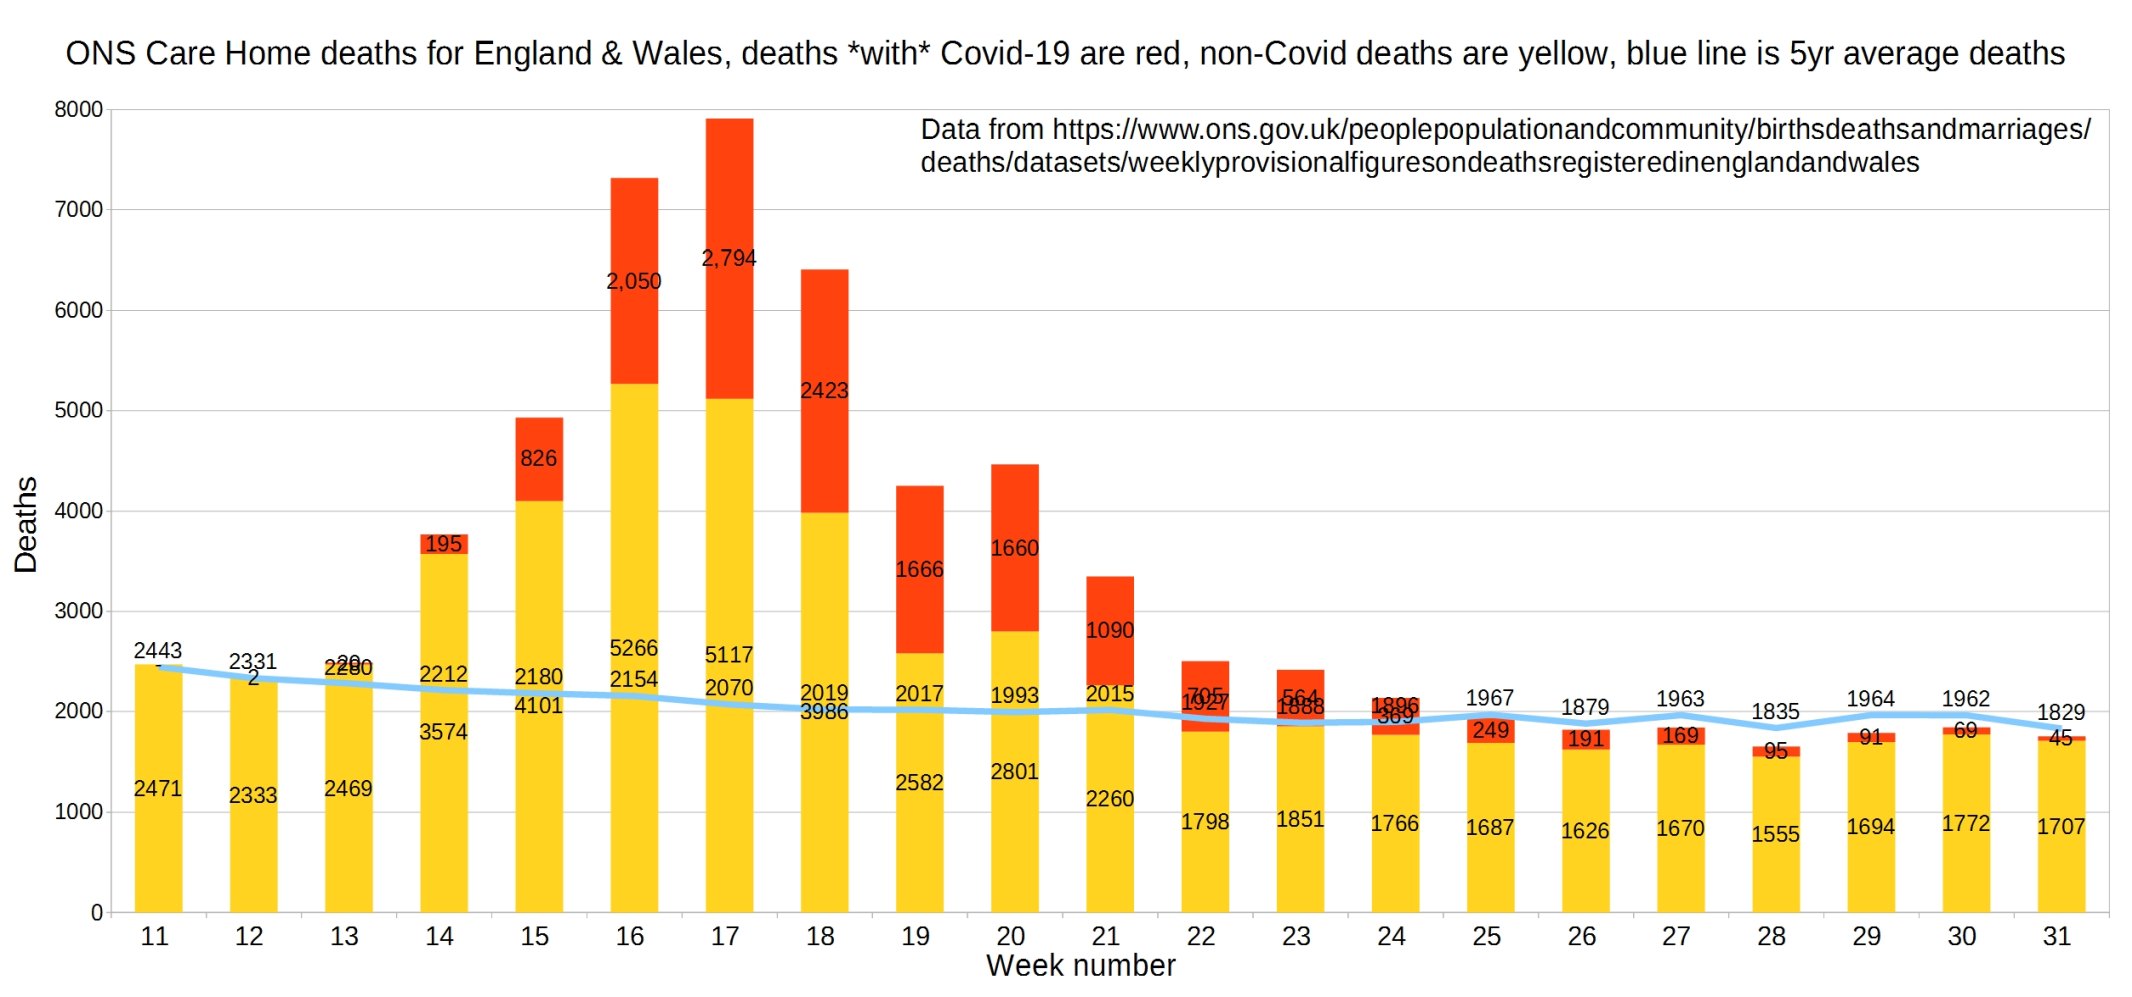
England and Wales weekly Covid and non-Covid care home deaths. ONS data.
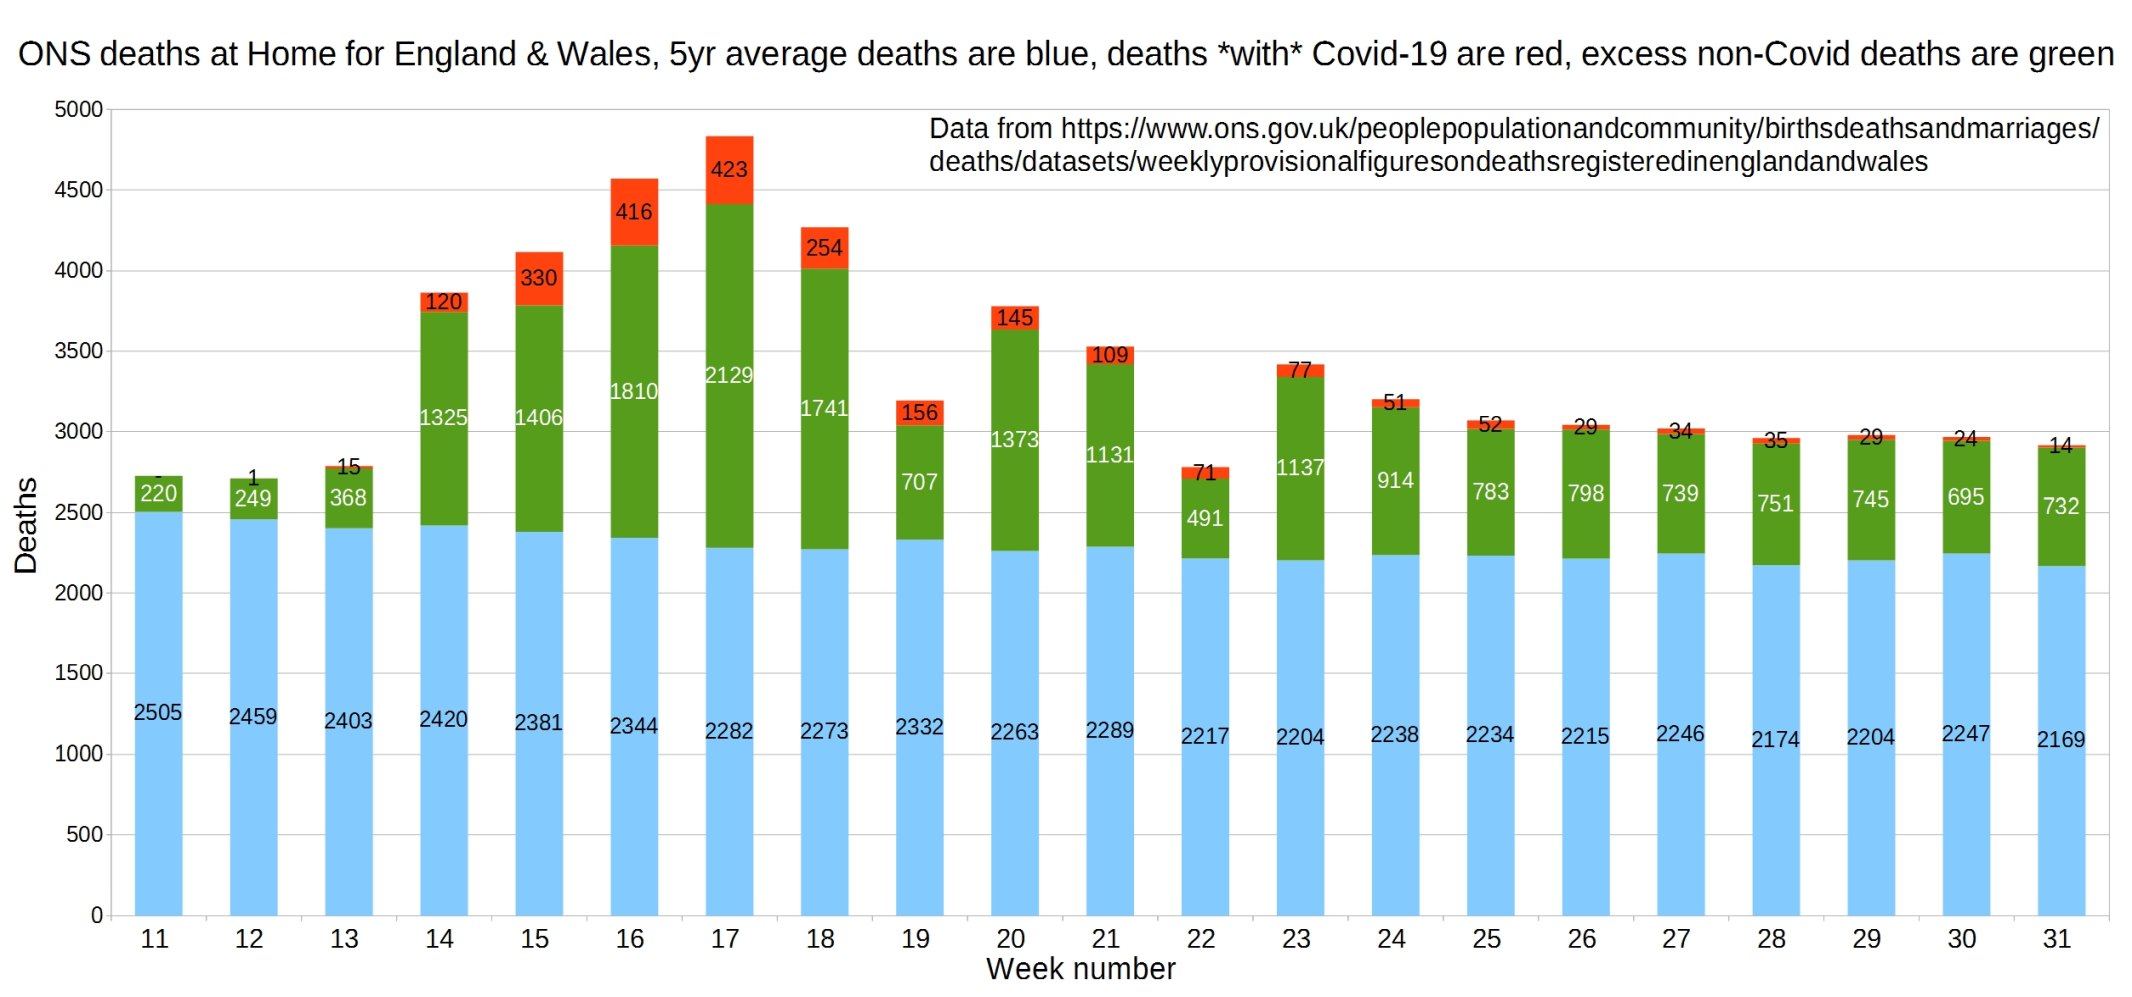
England and Wales weekly Covid and non-Covid deaths at home. ONS data.
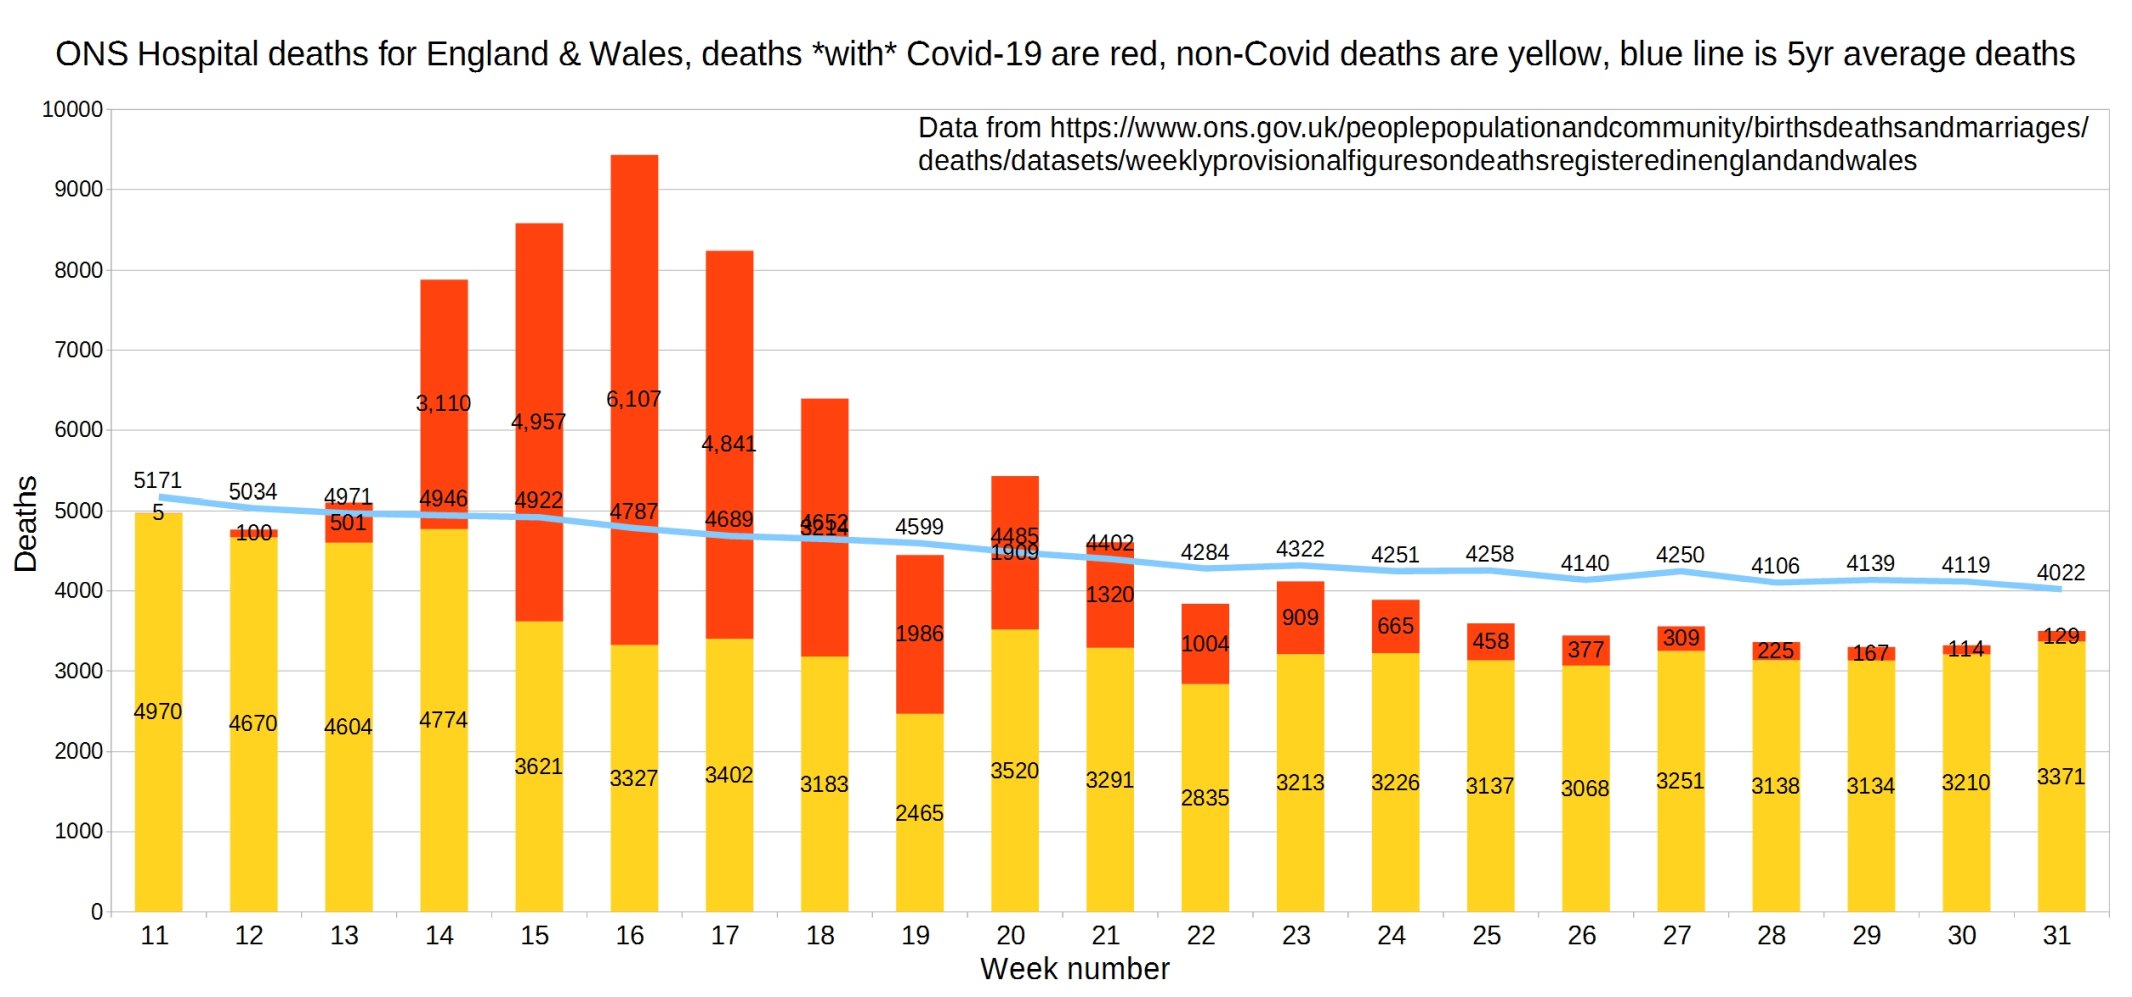
Hospital deaths for England and Wales. ONS data.
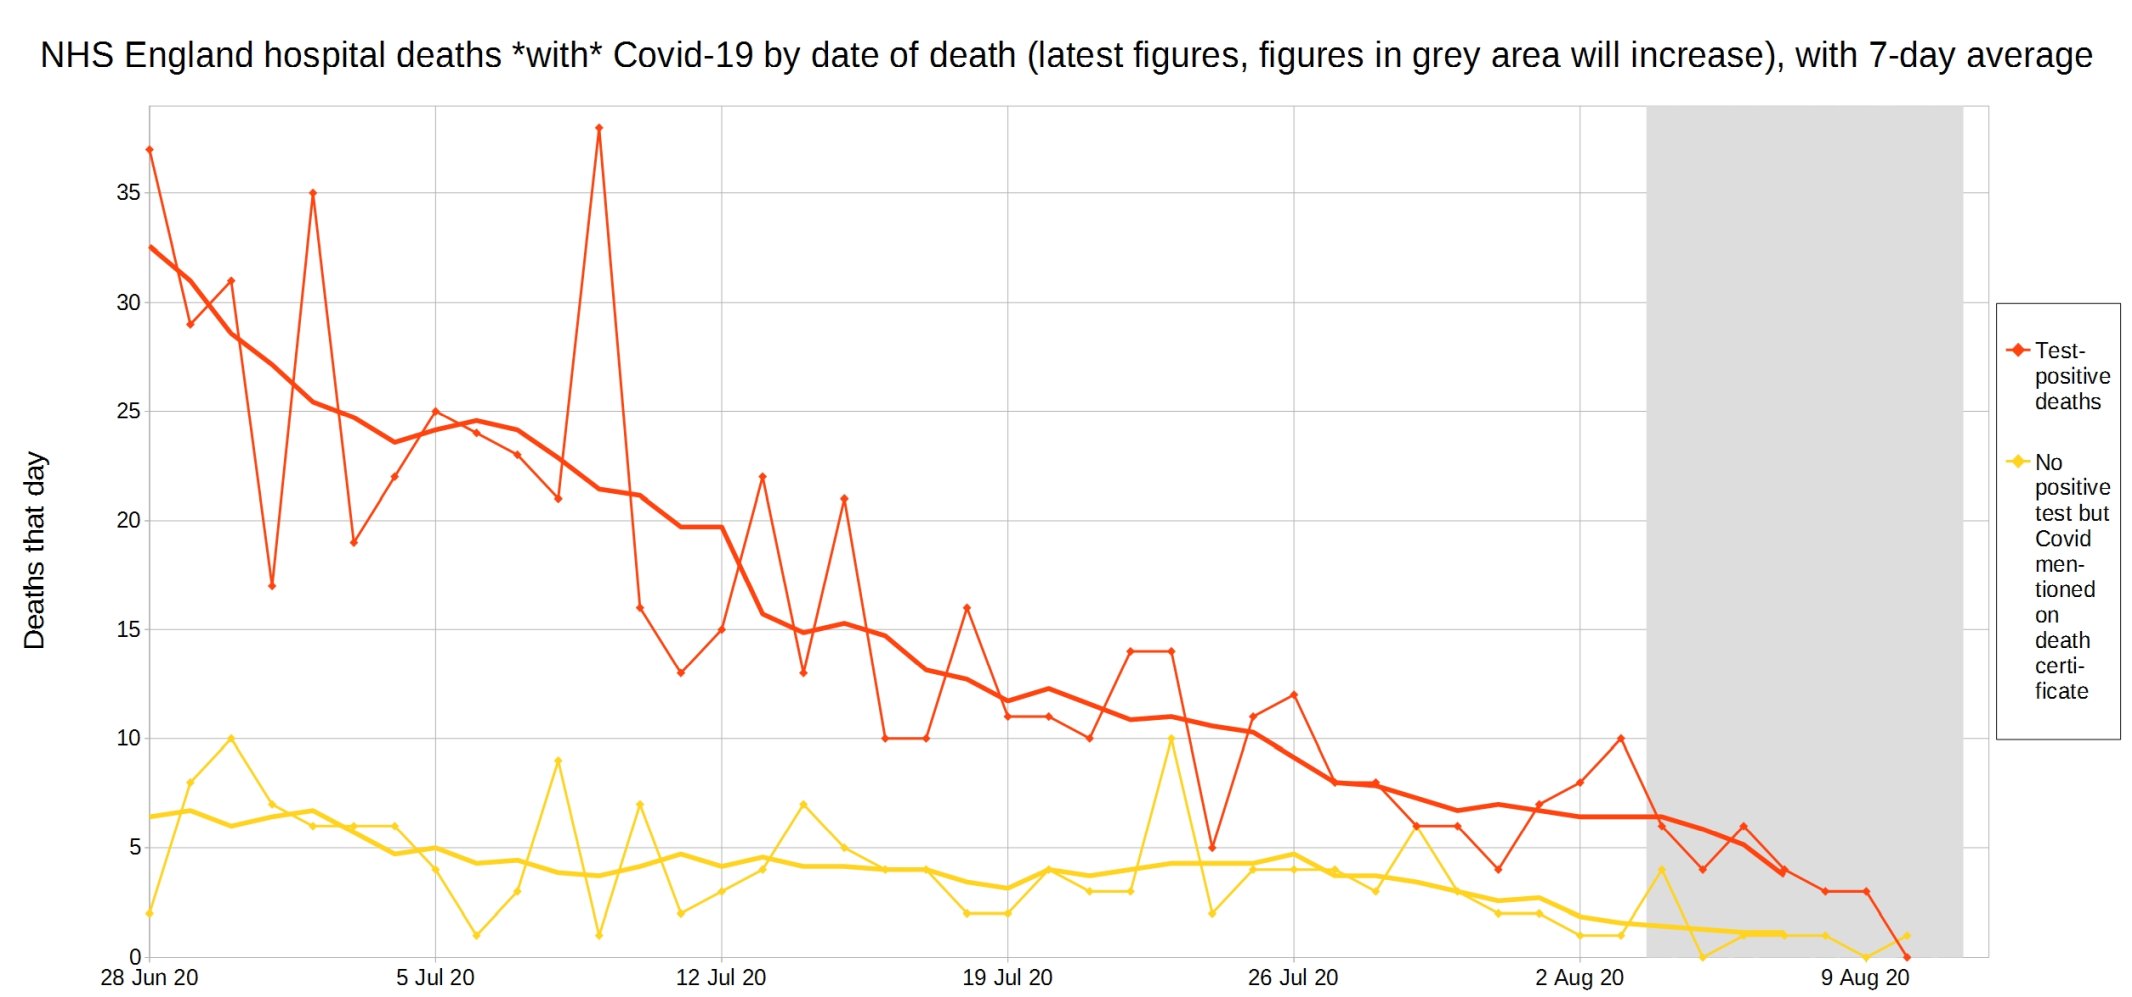
NHS England hospital Covid-19 deaths each day, latest reported figures, with 7-day moving average trendline.
All Covid, hospital Covid, and non-hospital Covid deaths in England each day, with 7-day moving average trendlines. (The blue lines are the ONS’s overall Covid-19 death figures, the reddy-orange lines are NHS England hospital deaths with a positive Covid result, the yellow lines are NHS England hospital deaths reported as Covid on the death certificate, but without a positive test result, and the green lines are the non-hospital Covid deaths, derived by subtracting the orange and yellow numbers from the blue numbers.)
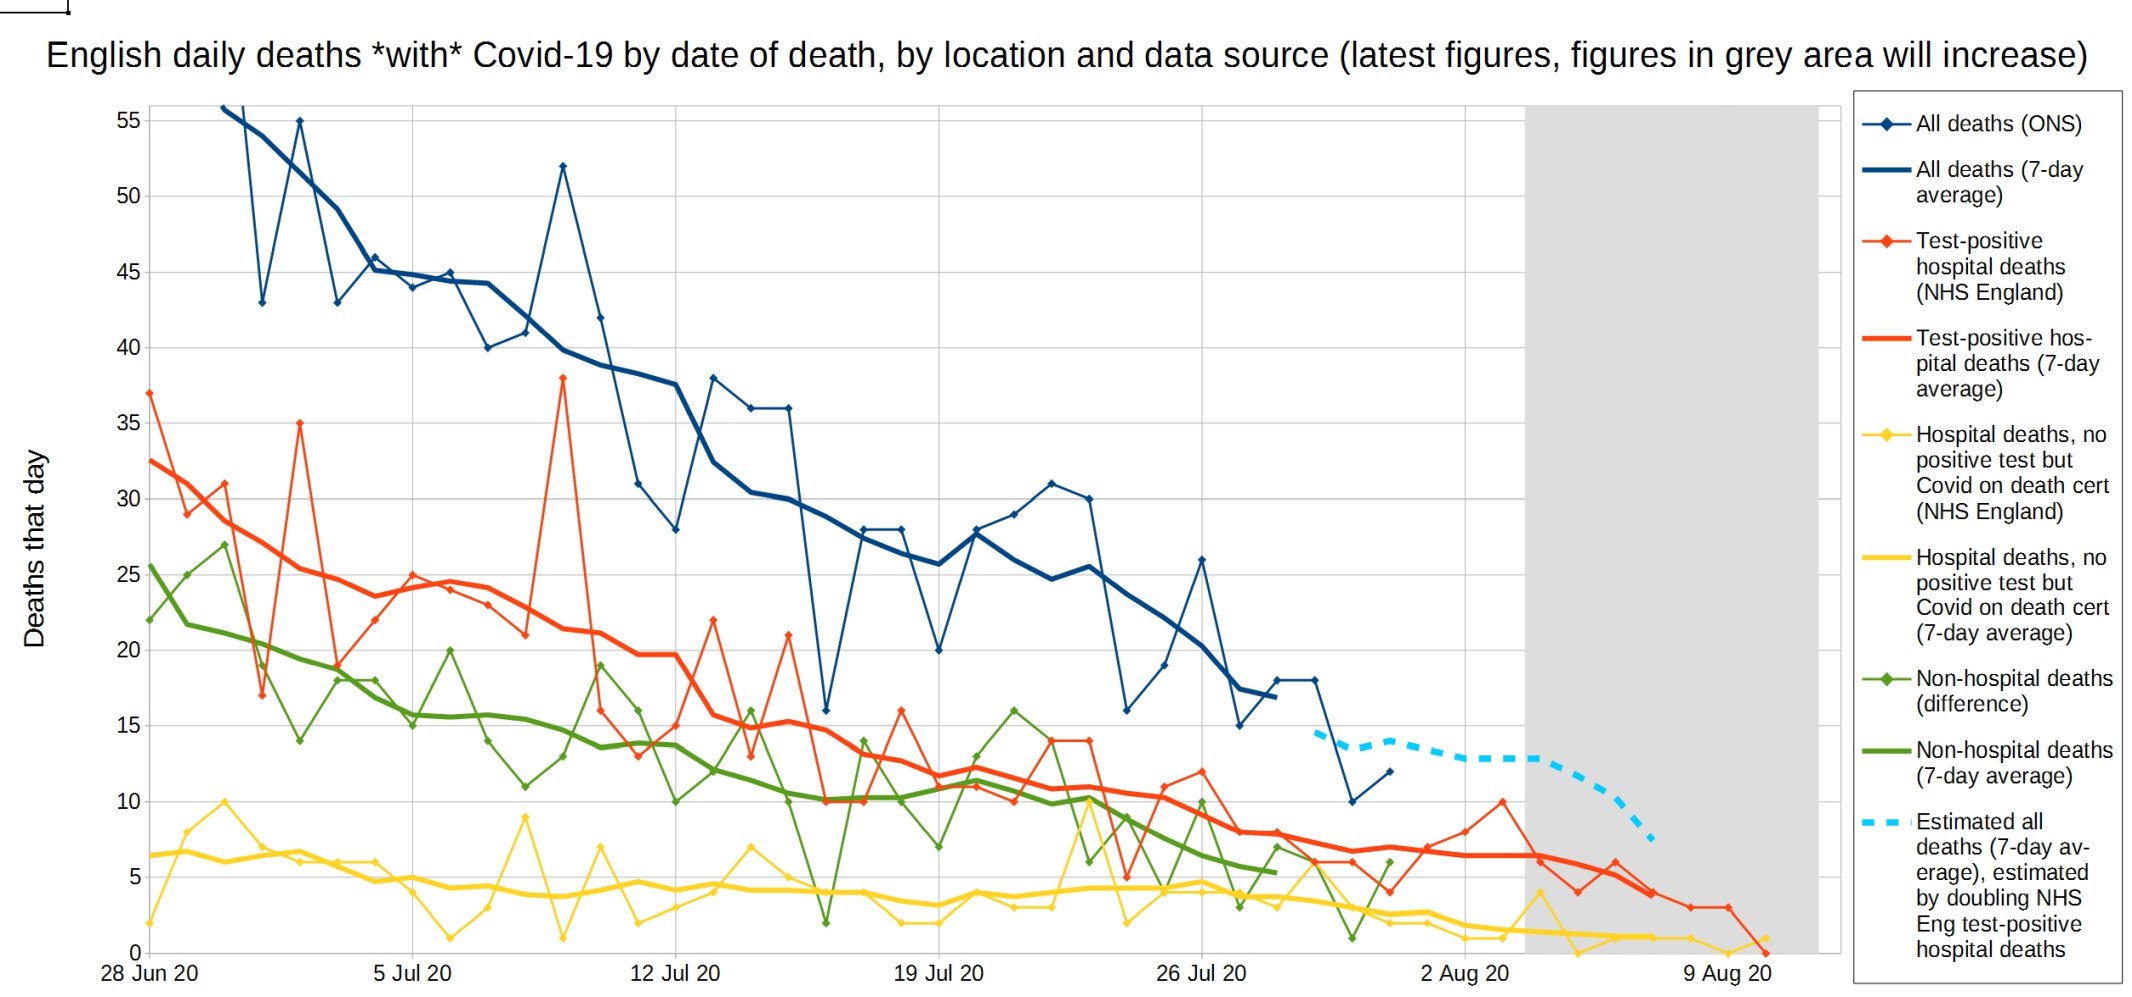
Christopher writes of this graph: ‘I realised the ONS count as Covid deaths all deaths where Covid is on the death certificate, even if there isn’t a positive test. So I have added two of the NHS England graphs. Otherwise when comparing NHS England and ONS [England] Covid deaths, it looked like non-hospital deaths were more than hospital deaths – as I wasn’t accounting for the hospital deaths with no positive test!’
[Christopher has also sent through some test result graphs which I am doing as a separate post.]
Update: Please support this website by donating via KoFi, subscribing via Patreon, or buying my book (see right-hand sidebar for links). Independent media like Hector Drummond Magazine, and my constantly updated Twitter account, cannot survive without your support. I’m going to look into a SubscribeStar account for those who don’t like Patreon.
Update 2: Lots of good posts in the pipeline.
16 thoughts on “Week 31 graphs from Christopher Bowyer”
Cracking as always! I have missed this over the past couple of weeks whilst Hector was away.
Thanks
Given the fact that such a large proportion of deaths are people over 75, what proportion of people in that age group do NOT have a medical condition of some kind? I would be very surprised if any do not have one condition or another so it’s hardly surprising that most people who die have a condition.
How many of the 1388 deaths, in hospitals, with no pre-existing condition are iatrogenic (i.e. caused by medical error) I wonder? Especially as the medical profession was giving treatments subsequently shown to lead to death in the majority of cases, for example forced ventilation, as the standard of care in the beginning.
‘ Note that we have now had seven weeks in a row of all-cause deaths being below the five-year average, which is, to say the least, somewhat peculiar…’
Perhaps. Or the ‘We who are about to die’ group, died sooner rather than later helped by Wu Flu or other non-direct factors caused by lockdown hysteria.
This was predicted by one of the advisors to the Swedish Government, who has said it was his opinion that a review of excess deaths in a years time not only will show no difference between Countries irrespective of measures taken, but will be on a par with ‘normal’ Winter ‘flu epidemics.
Time will tell, but data so far supports his view.
>Perhaps. Or the ‘We who are about to die’ group, died sooner rather than later helped by Wu Flu or other non-direct factors caused by lockdown hysteria.
Well, obvs.
This deserves more attention and public awareness to expose Covid scam
The Times has now reported what Speccie did a few days ago
‘Flu and pneumonia killed five times more than Covid last month‘ – According to the latest ONS figures, there were 193 deaths reported in the week ending July 31st that had coronavirus mentioned on the death certificate and 928 people who died of flu or pneumonia in the same period
https://www.thetimes.co.uk/edition/news/flu-kills-five-times-more-than-covid-9wlzsdlh9
Spectator: The Hidden Truth – Summer Flu Killing Five Times More Than Covid-19
https://www.spectator.co.uk/article/summer-flu-is-now-more-deadly-than-covid
Spectator paywalled, copy on pastebin:
https://pastebin.com/w6sTzuwS
BBC, C4, ITV, talkRadio etc still silent
Please re-post elsewhere
‘Flu and pneumonia killed…
WHO, Gov, Mainstream Media & Science Exposed – COVID-19 A Scamdemic
“Words mean whatever we say they mean”
https://altcensored.com/watch?v=5u4WY4ZwfO9
It’s the ‘all-cause’ mortality that is the real tale-teller, since any attributions to Covid are fatally (ha ha) flawed.
The comment about there now being 7 weeks with less deaths than normal, which does not suggest a ‘Black Death’ scenario, is incorrect.
I am sure that after the Black Death had ravaged through a village, deaths there were much lower than average. There were many cases of complete villages dying off and being abandoned – in which case deaths there would be zero.
Dodgy, you’re either very confused, or a troll. Either way it’s getting tiresome.
I’m afraid that ‘Dodgy Geezer’ has a dodgy grasp of facts and basic numeracy. The whole point is that there has been no particularly exceptional ‘ravaging’ this year overall.
In fact, over the last two years, mortality is running at the average level for the last quarter century.
What I find very alarming about all of this is the excess non-covid death in the Care Home and At Home data. There seems to be little discussion of this in MSM and I don’t think my MP recognised this when I wrote to him regarding the Leicester lockdown. Clearly Lockdown itself, and the policies adopted afterwards are not appropriate for those that do not have covid.
@Hector
imo @Dodgy is a gullible fool who believes everything BBC tell him, be it Covid is black death, World is overhearing, plastic is evil…
ONS and other stats mean nothing to him. He believes millions have died in UK alone and he’s next, bit like @MBE at TimW’s place
Wuhan Flu: Nov 2019 – 15 August 2020 Global Deaths ‘with’ 760,421 – 0.01% of world population (1 in 10,000)
https://www.ecdc.europa.eu/en/geographical-distribution-2019-ncov-cases
PJW on @Dodgy
Attack of the Corona Karens who believe hundreds of millions have been killed by C-19
https://youtu.be/AA6_GuZOyAI?t=187
@Siobhan
SAGE have concluded ‘life’ cost of lockdown is greater than ‘life’ saved
BBC etc silent, same as x5 more dying from Flu since mid June
Also of note is that All-Cause death is below 5 year average, but At Home death is above 5 year average, and has never gone below. At Home deaths are mostly non-covid deaths.
It is not safe to stay at home.
Comments are closed.