Here are some more graphs for week 14 of 2020, which have been done by an academic reader of my blog (based on the ONS stats).
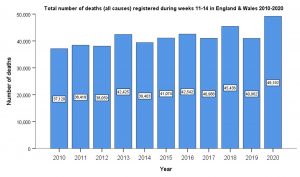
First we have a bar graph of the total number of all deaths by the end of week 14 for every year 2010-20, for England and Wales. (Click to enlarge).
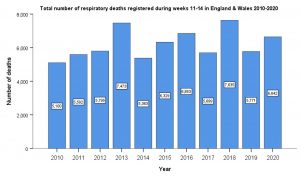
Here’s a bar graph of the total number of respiratory deaths by the end of week 14 for every year 2010-20, for England and Wales. 2020 figures include those Covid-19 deaths that were classed as respiratory deaths. (Click to enlarge).
Bar graph of the all-death numbers between weeks 11 and 14 for every year 2010-20 (Eng & Wales). Week 11 is when the first Covid-19 death was recorded. Here we can see some excess deaths over the norm for this period. (Click to enlarge).
Bar graph of the respiratory death numbers between weeks 11 and 14 for every year 2010-20 (Eng & Wales). As I said, week 11 is when the first Covid-19 death was recorded. In this period respiratory deaths are at normal levels, although there were 500 extra in week 14. (Click to enlarge).
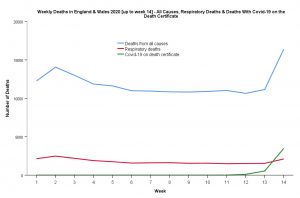
Line graph with all deaths, respiratory deaths and ‘with C-19’ deaths for 2020 (Eng & Wales). Note that the blue uptick (app. 6000) is larger than the green uptick (app. 3500). (Click to enlarge).
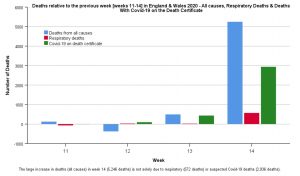
Graph of deaths relative to the previous week, for the all causes, respiratory, and ‘with C-19’ categories, for weeks 11-14, 2020 (Eng & Wales). (Click to enlarge).


34 thoughts on “More week 14 graphs”
That final graph is damned interesting. In week 14 3,000 of the 5,000 new deaths are WITH coronavirus, but only a small proportion of them can be FROM coronavirus because the deaths from all respiratory disorders are only 500. And another 2,000 are unexplained.
Are people staying at away from hospital, either because their appointments have been cancelled or they’re afraid of catching coronavirus there, and dying at home or in their care home instead?
But surely government has imposed new rules requiring anyone completing a death certificate to add Covid-19 as a cause if it is even suspected?
So how can anyone die of (or with) it without being counted towards the Covid-19 deaths total? Regardless of where they die.
It all makes no sense. What can Covid kill you of if not a respiratory problem? Why are respiratory deaths rising so little compared to all other deaths? Is it some sort of death recording issue? Are doctors just putting CV on the death certificate as shorthand for dying from respiratory failure? And what on earth is causing the big spike of non-CV deaths, a spike almost as big as the CV rise?
One can only assume its lack of attention to all other health issues, because everything is focused on CV issues. If that is the case the lockdown is killing more people who don’t have CV than people who get CV and die from respiratory failure. I suppose no-one notices or cares if someone dies at home from a heart attack because they failed to call 999 early enough because they had been told to ‘Save the NHS’. That won’t get on the BBC website.
“I suppose no-one notices or cares if someone dies at home from a heart attack because they failed to call 999 early enough because they had been told to ‘Save the NHS’. That won’t get on the BBC website.”
Indeed. The saturation media coverage is skewing perceptions of Covid-19 compared to other risks and deaths which the media don’t cover unless it’s something sensational like a terrorist attack or big road accident. They’re creating a massive case of availability bias even worse than in normal times. And they won’t notice all the early deaths in future caused by wrecking the economy. Essentially we’re letting non-Covid infected people die early both now and in the future to save the Covid infected ones.
It is simply mass hysteria driven largely by a scientifically ignorant broadcast and publishing media.
I dare say the problem is more with the media than the government. How could that proposition be tested?
It’s possible that even a case of Covid-19 that’s mild enough that no-one realises you have it can finish you off. We’re pretty sure this happens with flu, that’s why flu numbers are probably under estimates.
But then again the extra deaths could also be nothing to do with Covid-19.
Well, it wasn’t the media that imposed the lockdown on the advice of a wholly discredited scientist with a track record of getting things completely wrong and causing immense damage to society.
And if the government allowed itself to be influenced by the media, it shouldn’t have.
As the great journalist I.F. Stone wisely said, “All governments lie, but disaster lies in wait for countries whose officials smoke the same hashish they give out”.
It always astonishes me when (as they frequently do) officials and commentators suggest that a government has done the wrong thing, or failed to do the right thing, because it was “preoccupied” with some other issue.
We all hear a lot (far too much IMHO) about the virtues of “multitasking”. For individuals it is usually a bad idea; you can get a lot more done (and to a higher standard) by concentrating on one thing at a time.
But governments cannot possibly make this excuse with any plausibility. A cabinet of dozens of ministers, each with a civil service department numbering thousands, and supposedly distilling the greatest experience and skill of the nation… how can it plead that it was overwhelmed by the need to do two things at once?
And the NHS is not exactly short of specialists, specialist departments, and clever administrators. Surely it is not too much to expect that they handle a seasonal respiratory virus without dropping all their other plates on the floor?
Interesting stuff. I’d like to see an update for week 15 though as apparently deaths have risen significantly recently.
“Are people staying at away from hospital”
They must be, as many reports are surfacing of A&E depts being largely empty, in stark contrast to their normal situation.
Lockdown the media for a month?
From the BBC: “Wuhan, where the virus emerged, revises its death toll up by 1,290 to 3,869 – an increase of 50%”
Is Beijing finally realising that it is losing face and credibilty over its outlier WuFlu figures compared to the rest of the world?
Shorty after posting that comment I spotted this:
http://thylacosmilus.blogspot.com/2020/04/when-is-good-news-not-good-news.html
“Medical leaders have warned sick patients not to avoid getting help from the NHS after a huge drop in the numbers of people attending A&E departments sparked fears some could die without care”
A propos computer models – especially complex, poorly documented C programs…
Reading about Professor Neil Ferguson’s millions of lines of uncommented C code reminded me of something from a while back.
In 1995 Les Hatton’s book “Safer C” was published. (Les Hatton is a distinguished British computer scientist https://en.wikipedia.org/wiki/Les_Hatton). The following extract is longer than I would like, but I hope it is worth the time it takes to read.
“The author had some experience of the intractability of weather prediction software while working as a numerical weather prediction scientist in 1973-74 at the UK Meteorological Office, his first real job. While rewriting a forecasting model in a new coordinate system, he discovered a gross error in the existing model whereby the non-linear terms in the governing fluid equations of motion, the Navier-Stokes equations… were zeroed every other time step. This error is indeed gross, in that the non-linear terms are entirely responsible for the weather: without them, the atmosphere would essentially degenerate to hydrostatic equilibrium. Amid expectations of immediate fame and fortune, the correction (an accidental transposition of two assembler statements), was duly made and a 72 hour forecast rerun. The differences were almost undetectable. To this day, the author does not fully understand why and has an abiding distrust of weather forecasting software, not to mention most other software”.
One wonders whether something similar might have happened in Professor Ferguson’s cherished computer model. After all, how can we know that a computer model is accurate? Only by testing it against reality. Weather forecasts can be tested every day (often to their detriment); but how often can predictions of the harm due to coronavirus pandemics be tested? Approximately never.
A model like Professor Ferguson’s is essentially an automated and speeded-up embodiment of his theories. Which may, like all theories, be wrong.
At times like this the old computer folk saying rings true and alarmingly loud: “To err is human; to foul [or insert your preferred verb] things up on a gigantic, industrial scale requires computers”.
You remind me of the occasion in which a card tray got spilled – one of four for the model I was running. It took a very long time to ensure that all cards were reassembled in the correct order. Hardest was sorting the data cards. The FORTRAN was the easy bit – did it compile, and did it look like the code I’d written out for punching? First runs afterwards produced some dubious output, and it turned out there was still a small rogue element in the order of data cards.
I think the example of Public Health England shows that unless a State bureaucracy is having its feet held to the fire by public clamour (and thus political pressure) it will just meander along doing very little of use, and indeed quite a lot of active harm. We have arrived at a situation whereby the public health body has an annual budget of £4.5bn and has spectacularly failed to protect public health one jot when an entirely predictable public health crisis has hit, being more interested in berating people for drinking too much, smoking and not eating 5 portions of fruit and veg per day. And eating meat, climate change etc etc etc.
Most public administration is fundamentally chaotic and disfunctional (I have a friend who works in Probation, its entirely like that), and frequently makes grievous errors, they just rarely ever get made public. The UK Civil Service is less a purring Rolls Royce, more a spluttering banger that is perilously close to seizing the engine at any minute.
I bet your computer model didn’t involve 13 million lines of uncommented C!
We have been watching our DVDs of “Yes, Minister” and “Yes, Prime Minister” – and it’s astonishing how relevant many episodes are today.
Like the hospital that is proclaimed to be a triumphant example of best practice – although it has no patients. One bing asked, the administrator points out that patients make everything messier and less efficient.
Apologies to everyone. I have just seen Ferguson’s statement again and it refers to “thousands of lines of undocumented C code”, not millions of lines.
This moment the presenters of UK Column have informed us that Ferguson has posted the code to GitHub so that anyone can inspect it. Although without comments and documentation that will be hairy.
It was thousands of lines of undocumented C, not millions.
Week 15 ONS data will be out next Tuesday
//SYSIN DD
GARBAGE
//SYSOUT
GARBAGE
Quite a few cards in the code began
C
which was helpful…
Hospital attendance data only seem to be monthly, with February being the most recent available.
Let’s hope there’s no bugs like having one rather than two equals signs in a conditional which can affect the output without causing an error.
Does anyone know common it is for such sloppy habits as undocumented code in academia?
Was there really a 50% spike in total deaths in Week 14 (Week Ending Apr 3)? My spidey sense is tingling.
First, note that until very recently, ONS death statistics was a very sleepy backwater in the bureaucracy. It was only 3 weeks ago that their version of Excel was upgraded from Excel 97-2003, for Goodness sake! Suddenly, it has become a hot area — software upgrades, presumably new bureaucrats drafted in with all the usual problems that causes. And all this happening at a time of great disruption, with many of the offices which normally supply data to ONS locked down.
Give them their due, the guys in ONS are trying. For deaths ascribed to C-19 (setting aside the issue of the accuracy of that categorization), ONS are departing from tradition and trying to show date of death as well as their usual date of registration. But ONS have not extended this effort to total deaths.
A common rule in data analysis is to look at cumulatives if there are doubts about the reporting of daily/weekly figures. This shows that cumulative deaths in 2020 through Week 14 are well within the experience of the last 5 years. Nothing unusual.
2018 175k total deaths through Week 14
2015 170k total deaths
2020 166k total deaths
2017 164k total deaths
2019 156k total deaths
2016 156k total deaths
Bottom line — Week 14’s 50% spike in total deaths is much more likely to be an artefact of reporting rather than a dramatic increase in the death rate. Caveat emptor.
Some github URLs might be helpful. Here are some. Perhaps someone who knows better could post better ones?
A data repository, updated a few minutes ago at: https://github.com/CSSEGISandData/COVID-19
There seems to be a code repository at: https://github.com/ImperialCollegeLondon/covid19model
Jim.
Will change the story if it turns out to be the case. No longer politicians running scared of ‘Boris killed my granny’ (who was in God’s waiting room), soon it will be ‘Boris killed my daddy’ (prime of life but had a stroke).
‘Take all my money but spare my life’ is a reasonable decision for and individual to make. If your nearest and dearest lay a-dying I would quite understand if for you that took priority over the patient in the next bed. But politicians are there to make the hard choices, they get the glory, they must expect the odium too. Where do we find any willing to sacrifice their career to do the right thing?
I have had cause to visit a large hospital recently. Deserted.
Ah, JCL. That takes me back. Haven’t seen a line of it since I changed careers 20 years ago.
I quite agree that when your life is on the line, you have to get your priorities clear and pay any price for survival.
But there is always afterwards. I remember the story of Julius Caesar who, as a young man, was captured by pirates on a sea journey. Knowing his family could pay a good ransom, they did not harm him and treated him well. While eating and drinking together they became quite friendly, and shared jokes and anecdotes. One day, Caesar said quite openly that after he was released he would come back and crucify them all. Hilarity all round.
Less so when he did exactly that.
I have got used to even quite simple programs having millions of lines nowadays – and operating systems tens of millions. So I must have assumed that the model was so lengthy.
Whenever we assume, we make an ASS out of U and ME. (Irritating American slogan of the day).
Comments are closed.