If you download the latest ONS death stats spreadsheet, and look at the page entitled ‘Covid-19 – E&W comparisons’, you will some some tables that are presented very unclearly. They do tell us useful something about the week 14 ‘Covid-19 deaths’ category, though. I’ve copied the relevant tables (click to enlarge):
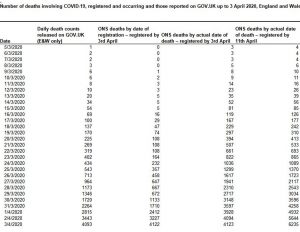
If you look at the second column, on April 3, when the stats were compiled for week 13 (March 21-27), there were 647 Covid-19-related total deaths for the year registered by March 27. As we had 108 registered by March 20 (end of week 12), that means 539 registrations came in between March 21-27, ie. in week 13. Hence, this is the C-19 death figure used on the ‘Weekly Figures 2020’ page for week 13.
But look at the third column. By April 3 we also knew that in actual fact 1941 people had died by March 27, not 647. That means that 1294 certificates for deaths that occurred before the end of week 13 must have arrived in week 14 (March 28-April 3). Although these were deaths that occurred before week 14 (mostly in week 13, plus a few hundred from earlier weeks by the look of it), they will be included in the week 14 stats, not the week 13 stats, because that’s how the ONS works, the deaths are included in the week the certificates arrived and were logged, not when the deaths occurred.
So it looks like to me that almost 1300 of the Covid-19 deaths that were reported for week 14 actually occurred in week 13 rather than 14, so the week 14 numbers are inflated by those.
In fact, we can see from the fourth column, which lists what we know on April 11, that a further 176 deaths had in fact occurred by 27 March, and these will go into the week 15 stats, even though they occurred in week 13.
But will a similar thing occur with the week 14 stats? Maybe the numbers for week 14 don’t include a lot of deaths which really did happen in that week due to certificates which arrived after week 14?
The fourth column tells us that this is in fact happening. But first look at the second column, right at the bottom row. For 3 April there were 4122 total Covid-19 deaths for the year that had been registered by 3 April. But the fourth column, bottom row again, tells us that by 11 April we knew that there were really 6235 C-19 deaths by 3 April. That means that 2113 certificates for C-19 deaths that occurred before 3 April must have come in between April 4-11. These will go in the week 15 stats, but they are deaths that occurred in week 14. So really week 14 had even more Covid-19 (and overall) deaths than we thought, even taking into account the 1300 that really occurred earlier than week 14.
So that’s one possible explanation ruled out for why there were a lot of extra deaths in week 14.
16 thoughts on “Some digging into the week 14 death numbers”
Sorry, unconvinced.
Look at “ONS deaths by actual date of death – registered by 3 April” for March 5, first line in the tabulation. On the ONS April 3 tabulation, that shows 3 C-19 deaths.
Look at the same March 5 line on the April 11 tabulation, and it has grown to 4 deaths. This change refers to a death that happened a month previously.
Implication is that ONS is struggling with the proper allocation of C-19 deaths to the actual date of death. And is finding it rough sledding.
ONS is not even trying yet to allocate total deaths to the actual date of death. But we can reasonably guess that when ONS does, the dates of deaths will change quite significantly.
Is the 50% leap in total deaths in Week 14 accurate? Probably not.
If deaths are counted by the date when the ceritificate is received (or even dated) that is disgraceful. A table of deaths MUST give the exact time and date of death, and that is the only accurate way of recording deaths.
Seriously all certificates will have a date of death and registered date, how hard is to
a-show data for both (based on some charts they are obviously already entering the date of death into whatever database/system they are using)
b-include a note on the impact of ‘late’ deaths in the registered date numbers
The next question is if this is a specific one-off catch up or just the change in the usual lag in reporting kicking in, I guess week 15 figures will show
Second week with excess deaths in England, first for Scotland and still no excess in NI and Wales. The figures do not support Gov ‘s Fatal Pandemic claim or their ordered shutdown and the msm hysteria
@Hector
What do you make of:
“In the week ending Friday, April 3, there was an excess of more than 2,500 [Non CV-19] deaths over what would be expected at this time of year.” ?
That’s an excess 357 non-CV-19 deaths daily. Has a 747 been crashing every day?
Dr Malcolm Kendrick’s latest blog post may shed some light on this conundrum https://drmalcolmkendrick.org/2020/04/17/care-homes-and-covid19/
He’s finding (as a GP) that many care home residents are dying rapidly, and while he suspects COVID he’s not sure enough to put it on the death certificate – so there may be more COVID deaths than registered.
@Tom – the ONS groups them by date of registration. The rules on this have changed several times over the years, but that’s the way it is right now.
It’s not like they don’t record the date of death in addition to the date of registration, it’s just that they summarise it by registration date.
One possible advantage of this would be that it allows them to publish fairly complete figures fairly promptly while lessens the need to go back and adjust them when late registrations are made (e.g. where deaths have been referred to the coroner).
Registrations are supposed to me made within a 5 days of death anyway, so it’s not like the two numbers would normally be very different.
Your government at work. From Pcar’s extract above:
“All-cause death registrations (ONS), England and Wales – In week 14 2020, an estimated 16,387 all-cause deaths (excluding COVID-19 deaths) were registered in England and Wales (source: Office for National Statistics).”
So. All-cause deaths EXCLUDE C-19 deaths? Bureaucrats are usually better with words than numbers. When they can’t get the words right, it shows they are struggling — perhaps understandably. We should remember that when looking at their numbers.
Ah, the 2,500:
Delingpod 69: Hector Drummond vs Covid-19 Hysteria
https://youtu.be/ga5IhhVmyR8?t=2971
@Gavin
Well spotted. If 16,387 all-cause deaths is excluding COVID-19, that’s ~4.600 above weekly average already. Doesn’t add up
Like Gavin, I’d say that this is PHE misunderstanding, or failing to write what they meant.
If you update figures faster than they take to come through the reporting process it is inevitable that the most recent data will be incomplete. So with a process that requires at least five days to gather the data a day by day report is simply misleading, it will always give an impression that things are tailing off in recent days, and the constant need to revise the numbers first reported does not give a perception of reliability. Better to wait 11 days and have a number that though lagging can be taken as a reasonable measure.
I’ve read through the ONS spreadsheet in more detail, and it’s made my head hurt – but I think I’ve made sense of it.
You’re right that table in the “Covid-19 – E&W comparisons” spreadsheet tab, shows the Covid-19 deaths by actual date of death are higher than those by date of registration – and that the registered by 11 Apr deaths by date column shows higher Covid-19 deaths for each day, than the registered by 3 Apr deaths by date column.
So actually more people died of Covid-19 in Week 13 and Week 14, than is reported on the “Weekly figures 2020” tab of the ONS spreadsheet.
However, as the “Weekly figures 2020” tab of the ONS spreadsheet only shows overall deaths reported for each week, then deaths which occurred in those weeks but were reported in later weeks (like these Covid-19 deaths), would increase the actual weekly deaths by date of death by the same amount.
So, the deaths with Covid-19 which occurred in week 13 & week 14, but were reported in later weeks, would also increase the overall deaths which occurred in week 13 & week 14 – by the same amount.
So, there will still be around 2500 non-Covid deaths more than the 5-year average for week 14, even if it was possible to count deaths by date of death, rather than by date of registration.
I hope this makes sense!
The conclusion from the observation that the “actual date of death” numbers are higher than the “date of registration” numbers has to be that the ONS tabulation is flawed.
Looking at the “registered by 3rd April” data, the cumulative deaths by actual date are 33,242 — almost exactly twice the cumulative registered 16,315. Double counting?
All of us who work with spreadsheets have experienced that “Oh Shit!” moment, especially when we are working hard in difficult conditions against a deadline, as ONS staff are currently doing.
The numbers you are adding-up are already cumulative.
Comments are closed.