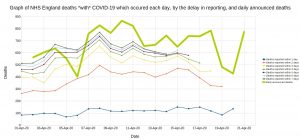
Christopher Bowyer has sent me some graphs of the NHS Covid-19 death data. Here’s a graph of NHS England Covid-19 deaths and the delays involved (click to enlarge).
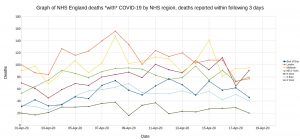
A graph of NHS England deaths with Covid-19 by NHS region (reported within 3 days) (click to enlarge).
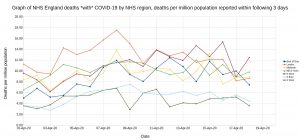
A graph of the same NHS England deaths with Covid-19 by NHS region (reported within 3 days), but this time as rates (numbers per million) (click to enlarge).
Thanks to Christopher for doing these and sending them to me to share.
Share this article on social media:
6 thoughts on “Some NHS graphs from reader Christopher Bowyer”
Christopher, Thank you
Latest All-Cause Mortality Surveillance
23 April 2020 – Week 17 report (up to week 16 data)
“No statistically significant excess for Northern Ireland in week 16. Statistically significant excess for Wales in week 16 2020 and for Scotland in week 14 2020”
I’m still not concerned and still believe this is Not a global pandemic
Global Pandemic?
Population ~7,800,000,000 – 2,668,135(0.03%) cases of COVID-19 including 190,236(0.0024%) deaths
Irish Sea and closed borders working for NI?
Or is it: No snakes in NI? Lots of Orangemen in NI?
Just listened to your chat with JD, with regards to probability models. Italy is poised to financially bring down the EU with the contagion spreading world wide,a coincidence the virus started there in EU?
Wonder what the probability is of the people who have caused the depression that was coming anyway using this as a scapegoat.
Sorry to sound like conspiracy theorist but after 2008 and the lunacy which cannot continue, some thing needed to come along to save their skins.
https://www.breitbart.com/europe/
– 40 Per Cent of Italians Want to Leave The Euro and the European Union
– Coronavirus: International Flights Continue to Bring 100,000 Unchecked Travellers a Week to Britain
– Petition Demanding Resignation of W.H.O. Chief Passes 1M Signatures
https://www.change.org/p/united-nations-call-for-the-resignation-of-tedros-adhanom-ghebreyesus-who-director-general
The first graph shows what most visiting here understand already – that the quoted daily deaths are not all for the previous 24 hours. Looking at yesterday (England only)the announced 587 deaths were spread like this
https://www.cebm.net/covid-19/covid-19-death-data-in-england-update-24th-april/
Mr Bowyer’s first graph shows the effect of that delay in announcements with time.
Nothing startling but important to note – BUT I saw a quote somewhere from someone with a degree in modelling who reckoned that the input each day into the Imperial model was the announced deaths figure. That will produce an erroneous result.
You’d think the model would have some factor to account for known differences in deaths and that it would later be compared to a model without the adjusting factor and the actual numbers entered
I’m glad you found the graphs useful 🙂
I read about the Imperial model taking the announced deaths figure too, I saw it in this blog post https://wmbriggs.com/post/30412/
Comments are closed.