This is an article from Simon Anthony, a one-time theoretical physicist.
A few days ago, in response to an article by Hector Drummond on the Critic website, I wrote a short piece, also carried by that website. I argued that, if the sex ratios of non-Covid-19 deaths haven’t been changed by the advent of C-19, the number of deaths attributed to C-19 in the each of two recent weeks of data from ONS has been over-attributed by more than 3,000 each week.
I thought it would be useful to test the underlying premise – that 2019 sex ratios of deaths are a reasonable approximation for recent non-C-19 deaths – by seeing how it held up in other circumstances. The first and most obvious question was how many C-19 deaths would be estimated for the weeks before C-19 arrived? Ideally it would be zero but in practice sex ratios fluctuate at random which potentially might lead to wildly wrong estimates. Here are the estimates for C-19 deaths since mid-January based on unchanged sex ratios (USR) compared with ONS attributions.
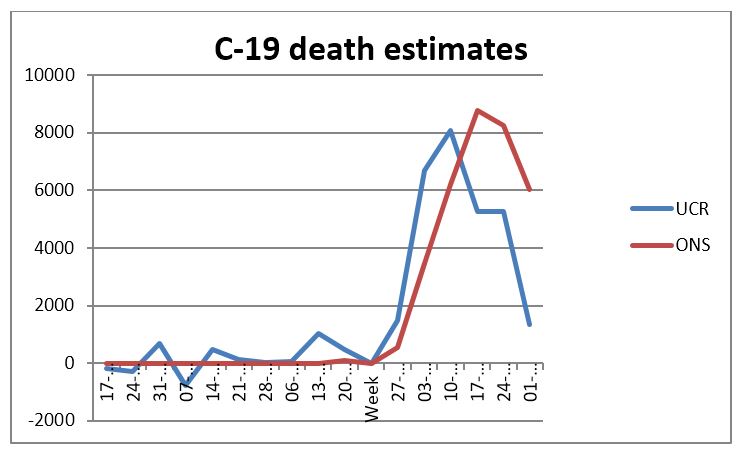
That looks plausible – there are fluctuations around zero for the weeks before C-19 arrived are but they’re so small that there’s no possibility of mistaking the ‘noise’ for the signal: USR seems to reliably pick up the presence and magnitude of C-19.
But there’s something curious about the relationship between the USR and ONS estimates. It’s seen more clearly in the following chart of the difference between USR and ONS estimates of death due to C-19:
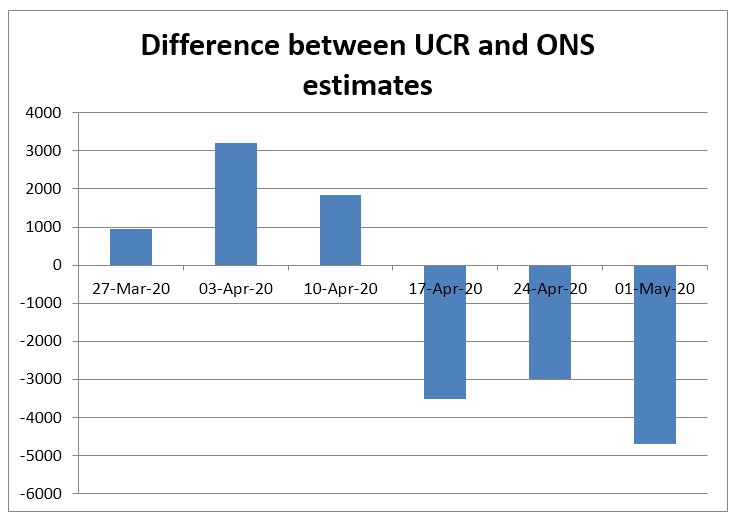
For the first 3 weeks, USR estimates are between 1,000 and 3,000 higher than ONS. Then for the last 3 weeks, ONS estimates are ~3,000 – 4,000 higher than those of USR. In particular, between the weeks ending 10 Apr and 17 Apr, there was a reversal from USR attributing ~2000 more deaths to C-19 than ONS, to ONS allocating over 3,000 more than USR.
From an apparently reasonably stable pattern (USR>ONS) there’s an abrupt reversal to another (ONS>USR). Did this switch have a cause or is it just a random jump?
I thought it would be worth seeing what might have caused such a transformation. The obvious initiating event took place on 25 March when the Coronavirus Act received Royal Assent. Under the act the criteria for attributing death to C-19 were set out. On 31 March, the government published guidance on ‘Completing a medical certificate of cause of death’ (MCCD). This was updated on 1 April. Over succeeding days, other government guidance notes (e.g. for medical practitioners completing cremation forms, updated on 3 April) were updated.
While it would be untrue to say that the guidance ‘encourages’ attribution of deaths to C-19, its first sentence is ‘In an emergency period of the COVID-19 pandemic there is a relaxation of previous legislation concerning completion of the medical certificate cause of death’.
Particular criteria for naming C-19 as cause of death (CoD) have been relaxed compared to those of other causes of death. For example, the MCCD can be completed by any doctor, whether or not they saw the deceased before or after death, pre-mortem C-19 symptoms without a test result can be certified as a C-19 death (the cause of death may be re-assessed when the test result is available) and CoD as ‘old age’ and variations is strongly discouraged if C-19 is present.
Over the following days other organisations published and publicised advice on the guidelines. For example, on 4 April, the Royal College of Pathologists published guidance on the implications of the C-19 Act for death certification and registration. On 6 April the MDU (Medical Defence Union – leading UK provider of indemnity against clinical negligence) published its advice on ‘Certifying deaths during Covid-19 outbreak’. On the same day, GP Online published an article from the MDU on the same topic. On 8 April, Pulse Today published an article on the Chief Coroner’s Office guidance on completing MCCD during the C-19 outbreak. And so on.
So, starting in the first week of April, guidance was widely shared with those responsible for completing MCCD forms. This guidance both highlighted C-19 as a CoD and loosened the criteria for its attribution. It’s also worth noting that ONS attributes a death to C-19 where COVID-19 was mentioned on the death certificate’ i.e. C-19 may not be named as the direct CoD but would still be attributed to C-19. It seems likely that all these factors would tend to increase the number of deaths attributed to C-19.
As for detailed timing, the ONS records deaths by date of registration rather than date of death, often leading to delays of a day or more between death and the ONS recording of the event. As the guidance was disseminated during the first week of April, it seems likely that recorded deaths would begin to show its effects only some days after that time. The switch (according to USR) from under- to over-attribution of C-19 deaths seems to have happened on ~10 April, which is consistent with this sequence.
While I can’t be sure that USR is a reliable way to accurately assess how many people have died from C-19 rather than as excess deaths from non-C-19 causes, it correctly identifies the presence and scale of the C-19 outbreak and correlates reasonably well with other methods of attribution (e.g. ONS). If correct, it seems to show that, possibly due to pressure from government guidance, recent deaths have been over-attributed to C-19.
It’s worth noting that, before guidance was issued, deaths were (according to USR) under-attributed to C-19 as might be expected because of the commonality of many of its symptoms with previously more common CoDs. However, the earlier under-counting has now been more than compensated for by the recent over-reporting of C-19.
The significance of the possible misattribution of CoD to C-19 is clearly illustrated by comparison between the estimated number of deaths from C-19 and excess deaths due to non-C-19 causes (that is, the difference between the number of deaths due to all non-C-19 causes and the average number of deaths in that week over the past 5 years), using the USR.
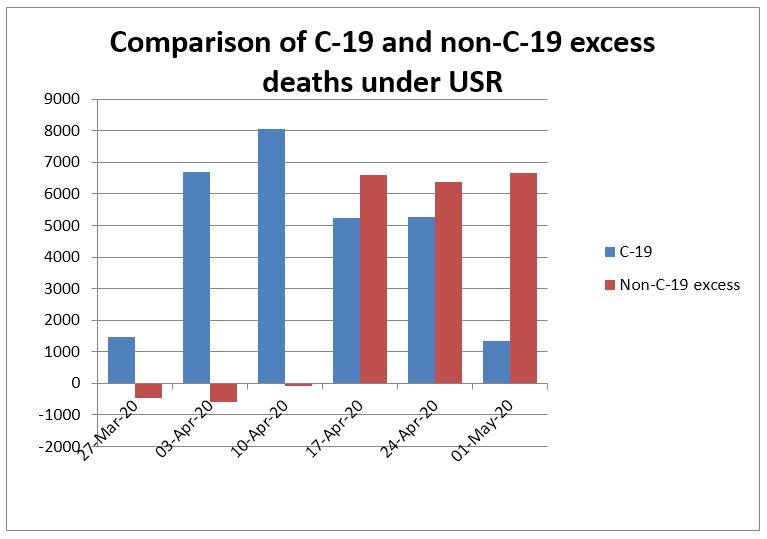
Before the week ending 17 April, there were a large number of deaths due to C-19, with a peak of ~8,000 in w/e 10 April, and essentially zero excess deaths due to all other causes. From the w/e 17 April onwards, while the estimated number of deaths due to C-19 has fallen to ~1,300 in the most recent week, there have been more than 6,000 excess deaths in each week due to all other causes. If USR is correct, for the period from 10 April to 1 May, almost 8,000 more excess deaths have been due to non-C-19 causes (19,649) – in part at least due to lockdown conditions – than due to C-19 itself (11,856).
11 thoughts on “Simon Anthony: How many people have really died from Covid-19?”
Are we seeing a leap in Sepsis deaths in care homes and ppl at home?
I suspect an answer will only be found by a detailed analysis of the causes of all non-C19 deaths
The latest ONS week 18 (ending 1st May) deaths show a completely reversed picture. Non COVID19 deaths fell faster than COVID19 deaths. So the explanation provided in this article, that many people are dying from the effect of the lockdown, no longer make any sense. Why would people be dying from the effects of the lockdown in the first three weeks of April but not the last week? You would expect the numbers to increase. I have always been suspicious of the notion that closure of hospitals leads to more deaths. It overestimates the impact of medical treatment on reducing mortality and underestimates its impact on increasing mortality (deaths due to medical intervention). I suspect that we had more deaths due to CORVID19 at the start of the pandemic than where being recorded, we now have fewer than are being recorded (for the reasons indicated in this article). Another fall in all excess deaths next week which is the same as last week will mean we are almost back to the normally expected number of deaths. Given the ONS weeks figures are almost two weeks out of date, death rates as of today could be back to normal
I’m not sure I understand your point. The article says that (assuming sex ratios for non-C-19 deaths are unchanged) the number of excess deaths from non-C-19 causes (i.e. those due to lockdown) has remained more or less constant (at ~6,000) for the last 3 weeks. As you say “Why would people be dying from the effects of the lockdown in the first three weeks of April but not the last week? , this is presumably more or less what you’d have expected i.e. people have died from the effects of LD in much the same numbers in the last week as in the preceding two weeks. Have I misunderstood?
Also, you say “I suspect that we had more deaths due to CORVID19 at the start of the pandemic than were being recorded”. You’ll find that the article confirms your suspicion.
thanks;
if one looks at the blue bars; (C-19); it seems to me to be the bell-curve that all viral epidemics produce: so thank you for that; it is entirely in accord with what it should be;
and the red bars; are “collateral damage” and “friendly fire” as the US would say.
thank you very much for this
who knows Rich; “sepsis” is a very grand noun; sometimes folks just slip away quietly; isolated, frightened; terrified; separated; .. a heart attack; a stroke; maybe just despair, exhaustion, a sense of why is life worth living any longer, faced with the madness we see all around; so much trashed; so much smashed; so much madness.
“I have always been suspicious of the notion that closure of hospitals leads to more deaths.”
What? Pardon? Clearly folks with chest pain, abdominal pain or whatever are staying at home; symptoms/signs of cancer delayed; mental illness not getting supported; folks can’t be seen by mental health teams; I think we agree on many things, but I was confused by your statment. all best wishes
In my investigations of the Week 18 ONS data I found some strange patterns in the Covid deaths. Firstly, it appears there were two separate epidemics: one that hit males, and a later starting one that hit females.
https://datawrapper.dwcdn.net/KQpry/1/
Of course, the first thought is that this reflects the delay before infections started to take real hold in care homes. But there are some big changes in the apparent sex ratios over the weeks. Then there is the evolution of the age structure by sex. First males:
https://datawrapper.dwcdn.net/qLNQf/1/
Deaths were very few in the first couple of weeks, but the trend to ever older average age of death beyond that is clear. Which is surely odd, since you would expect the virus to hit the most aged first, not as an afterthought.
Look at the picture for females, and the ageing of the age structure is even more apparent:
https://datawrapper.dwcdn.net/WCN6o/1/
But we find that the process of re-allocating deaths from non-Covid to Covid even after they have been picked up by the ONS is still going on.
https://datawrapper.dwcdn.net/ynHzb/1/
I found it the previous week too (and I will go back and check out earlier weeks):
https://datawrapper.dwcdn.net/8BAcE/1/
Burying non-Covid deaths as being Covid deaths surely helps the narrative that shutting down the NHS for normal use was necessary and proportionate, rather than that it immediately caused a lot of excess deaths that were nothing to do with the virus (never mind the deaths that are to come from treatments missed and not started soon enough). It also defends larger estimates of the direct epidemic. So we have motive, means and opportunity. How does the jury find?
thanks so much “It doesn’t add up”; a great piece of data analysis.
we all feel there is much fudging of data; perhaps not as ferociously as in “Blue States” in the good ol’ US of A; they seem to be setting world records. Sir Humphrey would be proud of the UK scurrying around, to cover the ar**s.
Interesting charts, particularly the on-going reassignment: I wonder whether that will ever be uncontroversial.
I think (well, I would say that, wouldn’t I?) that this view may be unnecessarily complicated in that it requires two factors to explain the patterns: over-attribution of C-19 deaths and changing sex ratios of C-19 (and non-C-19) deaths. I can’t rule out that sex ratios of non-C-19 deaths have changed but I think that – without a compelling reason to think otherwise – the default assumption should be that they haven’t. This leads to the view put forward in the article – a period of under-attribution (due to unfamiliarity, reluctance to change) to C-19 gave way – following the issuing of “persuasive” guidance – to a period of over-attribution. Most recently the over-attribution has been very high.
I think that my charts broadly support your conclusions. I note that among over 80s, women are almost 60% of the population, but only 52.7% of those aged 70-80. It is unclear what the current sex ratio may be in care homes – it was 2.8 women for every man in 2011, so about 73.7%, but I suspect that has fallen somewhat.
Other things that might influence the age structure include improving treatment tending to favour the less elderly who are likely to be less compromised with other conditions. It seems unlikely that there would be a silent improvement in the outlook for men exclusively – that would surely have made the news.
Comments are closed.