
This is an article by Simon Anthony, a one-time theoretical physicist.
Hector adds: I don’t agree with all of Simon’s analysis here, but you don’t have to write something I agree with to get published here. If you’re thinking of submitting a piece, see the details here.
There’s been some disagreement about the justification for and consequences of lockdowns (he said, with a degree of understatement). In days, months and years to come, there’ll be furious arguments over whether lockdowns were necessary rather than less authoritarian measures. To begin to make the case for lockdowns, those in favour have, as an absolute minimum, to show that they worked in halting the spread of Covid-19.
The argument that lockdown will work
Fairly obviously, the purpose of a lockdown is to reduce the spread of the virus and consequent deaths by reducing the links between people. To reduce an R0 of 2.4 below 1 (the critical value below which the outbreak will be suppressed) to, say, 0.8, the average number of contacts to whom the virus is transferred has to be reduced by two thirds. The Imperial College paper which led to the UK’s lockdown mentions that, in their model, ‘approximately one third of transmission occurs in the household, one third in schools and workplaces and the remaining third in the community. These contact patterns reproduce those reported in social mixing surveys.’ So, if schools and workplaces are closed and community contacts are severed, that removes two thirds of contacts, leaving only the third of transmission which takes place in households. Essentially this is what the UK lockdown did.
The predicted effects of lockdown in the UK
For critics of the IC model, it’s worth examining in some detail the paper’s predictions. First, it predicted that if the measures of case isolation, home quarantine, social distancing for the elderly and school/university closure were combined, there would still have been ~250,000-350,000 deaths and ICU facilities would still not have been able to cope with peak demand. However, the paper went on to say that, if social distancing was extended to the entire population, not just the elderly, and the other restrictions kept in place, then deaths could be reduced to ~39,000 and ICU facilities may be sufficient. Such a level of social distancing would in practice require the closure or suspension of workplaces, social gatherings, restaurants, cinemas, sporting events etc, just as has been imposed under the current lockdown.
So IC’s prediction was that the lockdown would reduce the unmitigated hundreds of thousands of deaths to tens of thousands. (It’s slightly more complicated in that IC envisaged that lockdowns would be intermittent – triggered at particular levels of ICU admissions and then turned off when that number had dropped – so the figure of 39,000 deaths was cumulative over 2 years but with a large initial peak. This was under the least vigilant threshold which was however already exceeded when lockdown began in the UK. It’s therefore likely that many of the deaths which under Ferguson’s model happened later, were brought forward to the first peak which was consequently more lethal than the model envisaged. So I’ve compared Ferguson’s total over two years with the current UK peak) and that the then current ICU facilities would be – just – sufficient. Currently ~36,000 deaths in the UK have been attributed to Covid-19 and, although there was much talk a few weeks ago of ICUs being under pressure, it seems to have got by and not needed to use much, if any, of the emergency facilities which were hastily added.
Ferguson couldn’t be blamed for wishing that, rather than vehemently criticise the media’s version of his paper, people might actually read it and find that his predictions for the effects of lockdown really aren’t bad at all. In fact, given all the uncertainties, confusions and complications, so far at least they’ve been quite remarkably accurate.
Lockdowns elsewhere
In most other countries essentially the same lockdown pattern was followed, by a mixture of direct and indirect interventions, varying to a limited extent (in Sweden and Japan, for example) when local demographics (lower household sizes and population density in Sweden) or voluntary actions (again, Swedes seem to have social distanced readily; Japanese likewise) and cultural factors (Japan again) allowed the possibility. The outstanding exception seems to have been Taiwan which had previously developed systems and technology to prevent novel viral infections becoming established.
The evidence that lockdowns have worked
Overall, it’s not at all clear that there was really a great deal of variation between different countries’ lockdown protocols. Similar places closed and people socially distanced, whether by choice or imposition. If they worked as planned, such similar lockdowns should have had similar effects.

The chart above shows the deaths per day (averaged over the previous seven days so as to reduce weekend effects) for eight countries, starting from the day on which they imposed lockdown. The numbers on the left are the percentage of the maximum number of daily deaths for each country. (Sweden didn’t have a formal lockdown. Its start date is set as April 1 because on that day its government asked people to socially distance.)
It’s well known how varied the timing and allocation of reported Covid-19 deaths has been (hence the jagged appearance of the lines in the chart). The similarity of the shape of the lines for different countries despite such variation therefore seems to be persuasive evidence that the lockdowns have worked in much the same way wherever they’ve been applied. The overall pattern is common to all eight countries: a rise in the rate to a peak about ~3 weeks after lockdown, a few days close to the peak, then a decrease, at a lower rate than the initial rise.
Some people will be aware that, for example, the UK’s peak death rate is thought to have been April 8, sixteen days after lockdown. In the chart above, the peak is twenty-two days after lockdown. This discrepancy, and similar examples in other countries, is partly because I’ve used figures for daily announcements of deaths rather than the days on which they actually occurred and partly because the chart averages data over the previous week.
Proponents of lockdown will explain the shape of the curve as follows: before lockdown, Covid-19 was spreading exponentially. Over a period of a few days, lockdown halted this growth. Of those already infected, a proportion went on to die. The number dying each day grew exponentially for a time, just as the infections had done. On average, people who die from Covid-19 do so about 14 days after first showing symptoms. The average symptomless incubation period before then is ~5 days (these numbers are still debated). So the peak number of deaths per day should follow roughly 19 days after the peak of infections. As lockdowns took a day or more to fully come into effect, a lag of ~3 weeks would be expected between the peak of daily infections and that of deaths.
But of course these estimates can only be approximate. The date of lockdown may be misleadingly precise as it generally took place in stages and was preceded by a period of heightened anxiety and vigilance during which voluntary social distancing began. The obvious method of assessing the data of the peak of new infections – by counting the number of new cases – is very uncertain as it depends on the rate of testing, the conditions to be met for a test to be administered, variable delays between tests and reports… all of which differed between and within countries and which were constantly changing.
Comparison of R0
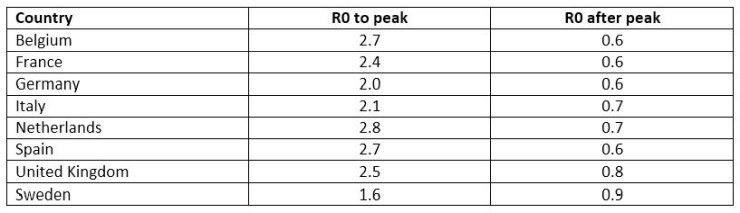
While the shape of the curves is similar, it would be useful to also compare the underlying numbers to see how well R0 matches (or differs) between the different countries. There are two distinct sections – the period up to the peak during which the mortality rate increased and R0 was greater than 1 and the period after the peak, when it was less than 1. For the reasons outlined above, the precise location of the peaks is imprecise so to calculate R0 for the upward slope I included points up to a week before the nominal peak and for the downward slope I included points starting a week after the peak. The table below shows the results:
There are several striking features among these numbers which are worth commenting on:
1. The first 7 countries have estimated R0s during the growth phase of between 2.0 and 2.8. An unmitigated outbreak with R0 greater than 2 would infect ~80% of the population.
2. The UK’s R0 during the growth phase is 2.5, very similar to that used by Ferguson in the IC paper, which would help account for the accuracy of the predictions made in the IC paper for ICU cases.
3: The first 7 countries have estimated R0s during the decline phase of between 0.6 and 0.8. All very similar, reflecting the similarity of lockdowns.
4. Sweden is an obvious outlier. Its estimated R0 during the growth phase is similar to the value (1.4) which I calculated in an earlier post on this site using case data. It confirms that the main reason for the poor predictions of the paper which modelled the epidemic in Sweden was its high value for R0.
5. Sweden seems to have had a significantly lower R0 before its ‘soft lockdown’ than any other European countries. However, with R0 at 1.6 Covid-19 would still have infected more than 60% of the population so some form of lockdown was necessary.
6. Sweden’s lockdown didn’t need to be as strict as other countries because its R0 in the growth phase was lower. It had only to halve the rate while other countries had to reduce theirs by up to two thirds.
7. As Sweden’s lockdown has been softer than in other countries, the effect has been less so it now has the highest value of R0, still fairly close to 1.
8. Although Sweden’s R0 is currently the highest, it’s still been reduced to a similar level to other countries, indicating that social and economic activity within Sweden is at a similar level to that of other countries.
Lockdowns worked
The aim of lockdown was to reduce the deaths from Covid-19 once the disease had begun to spread widely. It’s likely that, should there be an enquiry into officialdom’s decisions on Covid-19, charts and tables like those above will be used to argue that it’s succeeded just as planned everywhere it was tried.
All lockdown countries had R0s which would have led to ~80% of the population being infected. ‘Lockdown theory’ predicts that there would be a peak in the death rate two to three weeks after lockdown (imprecision due to earlier measures and voluntary social distancing) followed by a gradual fall as R0 fell below 1. This happened in a very similar way in all countries in which lockdowns were imposed.
The apparent exception – Sweden – had a lower R0 before its ‘voluntary lockdown’. Nonetheless, had no changes been made it would have suffered a widespread epidemic. The limited lockdown which was imposed, combined with apparently voluntary social distancing reduced R0 below 1 to a slightly higher but similar level the other countries.
The evidence is that lockdowns were both necessary to stop the spread of Covid-19 before health systems were overwhelmed and worked just as those who proposed them – principally Ferguson et al – had predicted. There’s still a question mark over the IFR of Covid-19. Deaths to date (see ‘The predicted effects of lockdown”’ above) have been similar to those predicted by Ferguson et al using an IFR of 0.9% under current lockdown conditions. As this prediction relied on his model correctly estimating the number of infections and hence ICU admissions, and since this prediction has turned out to be approximately right, it’s likely that the assumed IFR isn’t far wrong.
But did it have to be this way?
Perhaps there are other explanations for the apparent success of lockdown which might become clear when the spread of Covid-19 is better analysed. A key assumption made by Ferguson in his longer term strategy is that Covid-19 maintains its pre-lockdown values of R0 and IFR so repeated lockdowns will be needed to suppress recurrences. If R0 naturally falls, as the virus evolves, or the virus has already differentially infected the population so the most infectious people have already been immunized, leaving effective her immunity, it may not be necessary to repeat the lockdown.
But if those happy circumstances don’t apply, is there an alternative strategy to lockdown which might succeed without such extensive ‘collateral damage’? To continue the euphemistic language: has any nation ever used ‘friendly fire’ to such devastating effect?
Had all countries taken Taiwan’s approach at the outset, perhaps the world would have spared itself the social and economic wretchedness which seems likely to blight the future. How did Taiwan avoid self-harm? A contributory factor is almost certainly constant alertness towards China. When your nearest neighbour has sixty times your population and has made no secret of its aim of ‘reunifying’ your country with theirs, by whatever means necessary, including force, while in the meantime trying to undermine your economic and political position and international standing, you tend to watch them closely (I was going to say ‘like a hawk’, but perhaps more like a rabbit watching a hawk).
After SARS originated in China in 2004, Taiwan made preparations and established systems to deal with future epidemics. As soon as the first cases of Covid-19 were reported in China, Taiwan didn’t prevent travel – the links of its people with China are too close to do that except as a last resort. Instead, incoming flights from China to Taiwan were screened and infected passengers quarantined. When the disease nonetheless spread beyond arriving passengers (who presumably arrived during Covid’s asymptomatic period), all such secondary cases were tracked, traced and isolated, likewise their contacts. Covid-19 never got a chance to get established. So far Taiwan has had seven Covid-19 related deaths, in a population of 23 million.
Taiwan’s almost unique situation with respect to China underlies the preparation, vigilance and prompt decisive action which it took. Likewise Hong Kong, in some ways facing even more pressing threats than Taiwan from China, took similar measures and with similar results: four deaths in a population of 7.5 million.
It seems the best way to prepare for Covid-19 was to feel threatened by China. Covid-19 was similar enough to SARS that the systems Taiwan developed as a result of fighting the last war against a viral invasion from China worked just as planned against the newcomer. The rest of the world, lacking the paranoia which comes with being constantly menaced, was comparatively relaxed about the virus until it was so widespread that preventing its entry to a country would no longer stop it spreading further within the country. And so lockdowns followed because there seemed no alternative way to stop the virus.
Perhaps future pandemics can be prevented by all countries adopting Taiwan’s methods. Just as an individual’s immune system works best when it immediately identifies an incoming virus and eliminates it before it spreads within the organism, so nations must be constantly vigilant against inward bound viral threats and ready to stop them the instant they arrive. Otherwise, if they have the virulence of Covid-19, the only recourse may be another lockdown.
In the meantime, with Covid-19 established within countries, will ‘track-and-trace’, combined with rigorous quarantine and border controls like Taiwan’s suffice to control its spread without lockdowns? I don’t know, and nor perhaps does anyone else. We need another model…
71 thoughts on “Simon Anthony: Do lockdowns work?”
There seems to be an inherent assumption that the entire population is susceptible to the evil virus. Yet we have the Inconvenient Truth of the Diamond Princess experience, where 80% of those exposed to the virus were not infected — presumably already had some kind of natural immunity. The experience on the US carriers (with about 5,000 sailors per ship) was similar, although the demographics were quite different from a cruise ship. How could a disease spread exponentially when most of the population are already resistant to it?
On the other hand, if we make the inherent (non-valid) assumption that the entire population is Susceptible to the disease (for the SIR model), then we also have to assume that susceptible people will eventually encounter the virus and get Infected. All a Lock Down can do is to spread the infection over a longer period. Are the undeniable economic and health damages due to Lock Downs justified by spreading out the same ultimate infections & deaths?
Final thought — When ethnically-Chinese Taiwan and Hong Kong report such incredibly low C-19 death numbers compared to the rest of the world, the logical initial hypothesis has to be that the political desire to appear better than Mainland China may have influenced the always-controversial assignment of Cause of Death in Taiwan and Hong Kong.
“Final thought — When ethnically-Chinese Taiwan and Hong Kong report such incredibly low C-19 death numbers compared to the rest of the world, ”
Low C19 deaths are seen all around the Pacific Rim. Aus/NZ/Taiwan/Japan/Korea, even California. Is there any possible reason this thing hits some places hard (Europe/NY mostly), yet Japan/Aus/NZ almost untouched.
If the lockdowns have actually worked as intended, then there is no way out of lockdowns.
Apart from obvious arguments about when the peak occurred, changes in behaviour to a problem etc etc. The point that is consistently missed is that criminalising ‘freedoms’ like going outside, visiting friends and family and making a living should never be used by democratic governments unless the implications are so catastrophic that everyone would run and hide anyway. It was absolutely clear from the very early days that this virus was killing the old and sick and that the death rate would be in the ball park of other virus outbreaks if not lower. You did not need fancy models or a phd in epidemiology ( I understand Prof F doesn’t). My hypothesis: There was no need to do this to get a similar result.
Three words:
“Russia versus Belarus”.
The fact that peak infections appear to be before full lockdown tells me that our lockdown was an overreaction. You could justify it on the precautionary principle, if the collateral damage was slight or even moderate. But it isn’t and those who claimed such lockdowns would kill more in the long run are already looking to be right. After all the government’s High Consequence Infectious Diseases group had lowered the risk of Covid-19 to no longer a high risk on 19th March.. I believe Prof F is a member of that committee??
If you remove the 10k to 15k deaths of the return to care homes fiasco, you have a figure for deaths similar 2014/15 flu season (28k). Like all ILIs it kills the old and infirm in the main (92% over60, 52% over 80 -95% of all deaths with co-morbidities). Will we do this all again for every sizeable flu season? It isn’t flu, but it isn’t the Black Death either.
The main problem I think has been the one size fits all approach. Lockdown could have been used on the populated hotspots and just some sensible distancing, plus hand washing, and not touching your face elsewhere.
Given the small correlation between lockdown or no lockdown and outcome, I think we went the wrong route. -but what do I know?
I remember the flu epidemic of 1968/69 – 80k deaths, including a lot of children. I said to a friend recently that we didn’t trash the economy then, but then I realised that Harold Wilson was already doing that anyway!!
Lockdown was meant to give enough time for NHS to get more facilities to deal with the explosion of cases. Not for the reasons put forward in this paper which are now used as a post rationalisation.
Also the attempt to try to say Sweden and Japan are somehow on a different planet is also just ‘spinning’ to cover up the clear message they give.
Check the latest Euro Momo all ages excess death weekly chart, its a perfect bell shape. Europe in general is on or below trend, its over.
The volume under the curve is just 15% above the volume for seasonal flu related deaths 2017/18.
You cannot justify lockdown, or more properly martial law, and destroying people’s lives for this crazy overreaction to a virus.
Sorry but this article is hogwash.
We can make a direct comparison between NHS England data and Sweden – see series of tweets below. The data are very well fit by a Gompertz distribution across 80 days.
https://twitter.com/pfdgeologist/status/1264838174553112577?s=21
https://twitter.com/pfdgeologist/status/1264839394751586305?s=21
https://twitter.com/pfdgeologist/status/1264840081094979588?s=21
https://twitter.com/pfdgeologist/status/1264840680662355977?s=21
Data are based on actual date of death and not the reporting date. The epidemic never was exponential. The dynamics in Sweden are virtually the same as in England. I conclude that the lockdown in England had no impact on the trajectory or dynamics of the infection.
It will be interesting to do the same analysis for the other countries in Simon Anthony’s discussion if the raw data is available.
The premise of ‘lockdown’ – ‘Stay Home Save Lives’ – is universal risk of deadly contagion. But that’s false. Only the elderly or otherwise unfit through weakened immunity were at risk from this relatively mild virus. Transferring people from hospitals to care homes actually caused fatalities.
Confining younger people in the service of prolonging the lives of the aged, whom they’d scarcely come into contact with anyway unless deliberately, is prima facie absurd. You don’t need a computer model to establish that no one in your office is over 70. The overwhelming bulk of casualties have been from hospitals or care homes which are isolated by definition.
Millions have been arriving from abroad unchecked, a few in boats crossing the channel. To that extent ‘lockdown’ is also a fabrication. The notion of “death” as ‘wrong’ or ‘bad’ is no less absurd. Life guarantees death. Death can’t of itself be ‘wrong’ unless life is. A child dying before its parents is a source of terrible grief. But anyone over 80 is by definition close to death.
Similar numbers of casualties from respiratory viruses in previous years even with infant mortalities scarcely registered in the public domain. No one is more concerned with saving lives now than they were then. “Saving lives” is dramatic. In effect the duty of care of medical professionals has been universalised by sustained media/officialdom propaganda.
CV-19 has become a pretext for political accusation, licensing bullying by petty officialdom and private individuals alike. Venturing outside, failing to observe “social distancing” is supposed to be shameful. The media is largely an exercise in public shaming anyway. But it’s remarkable how opponents of ‘lockdown’ have been marginalised throughout the media. As if communist police state were the norm.
The CEO of YouTube even censoring eminent medical professionals for speech contravening WHO guidelines. Someone Tweeted about media holding government to account. But if anything the boot’s on the other foot. This Tweeted quote from GK Chesterton is closer to the mark:
“Thirty or forty years ago a great newspaper might be owned by about twenty tolerably rich men. But today it is not a question of twenty men owning one newspaper, but of one man owning twenty newspapers.”
One indication of the effect the Lockdown has had on the infection rate might be the numbers for which part of the population the newly hospitalised came from since the LD went into effect.
Are the new patients coming from those essential employees who carried on working or are they coming from those who are locked down?
I remember seeing one figure for New York that suggested 60% of new hospitalisations came from the ostensibly locked down population but I’ve lost that reference and anyway, it’s New York.
I would assume that supermarket workers who are still working would have a higher rate than hairdressers who are staying at home but it might be enlightening to find out.
Gavin L: I’ve read similar things from other people to what you say about the D Princess but according to the case data from the D Princess, on the days leading up to disembarkation, case numbers were still rising exponentially with a very good fit to an R0 of 2.8. On the very last day – ie the day of disembarkation – few new cases were found but the number of tests done was less than 10% of the previous day or the day before that. I’d say the DP was evidence that the exponential rise is still happening when 20% of the population has been infected. I haven’t looked at the US ship data; if I have a chance, I’ll see what I can find.
You’re quite right that a lockdown will mostly just spread out the infections and deaths over time. Nonetheless, it’s worth qualifying that to say that, if done well, LD will reduce the eventual number of deaths from C-19 by, say, 10% to 20%; worthwhile but not a panacea. But spreading out the infections and deaths was what the LD was for. Given the properties of C-19, in particular its R0, the NHS would have been flattened by demand more than 30x capacity. There really isn’t any way round that.
The essential difference between C-19 and flu which argued for a radically different response to C-19, is the speed with which it spreads. If all flu illness was concentrated in 2 months, the NHS would struggle even in mild flu years and would fail in a bad flu year.
But that’s an important point. The NHS has coped with flu, even in a bad year, without collapsing. There’s been no need for a lockdown. In contrast, to keep C-19 just within pre-existing capacity (+/- a bit), needed a lockdown. This is just what Ferguson’s paper predicted. In terms of both cases and deaths, F’s predictions for what would happen under LD seem remarkably accurate.
After I’d sent the piece to HD, I came across a blog post by Clive Best in which he says that he got Ferguson’s model to run and tested it against the lockdown we actually had (In F’s paper, the trigger – in terms of ICU cases- for lockdown was much lower than where we’d actually reached by the time LD started). So, whereas as I had to infer what F’s predictions might have been for the actual LD, CB ran a direct test. After comparing predicted deaths with ONS statistics, CB concludes:
“If you look at the bottom red curve which shows excess deaths directly related to COVID-19 then you can see that the lockdown predictions more or less agree with the outcomes. Does that mean that Neil Ferguson really did call the right shot? Probably he did,..”
I’m fairly sure that CB has been quite sceptical about LD and F’s model and was surprised to get this result. Good for him for reporting it so clearly.
David M: “If the lockdowns have actually worked as intended, then there is no way out of lockdowns.”
If nothing else changed, then yes, that’s correct. That’s what’s envisaged in F’s paper – a sequence of lockdown followed by open_up followed by LD… with both elements being “triggered” by ICU cases.
However, it’s very unlikely there’ll be no changes. Treatments will improve so the IFR will fall; fast, reliable tests will, eventually, be deployed; reliable track-and-trace will eventually be set up, with the aim of reproducing S Korea’s system; something approximating Taiwan’s border controls may be instituted; C-19 may turn out to be highly seasonal; the NHS will be (well, maybe) better prepared for future re-runs; there’ll be better understanding of which parts of LD matter most and which least, so its form will be adapted. And so on, always with the possibility of a vaccine being developed.
Rick: “My hypothesis: There was no need to do this to get a similar result.”
Ferguson’s model predicted, to remarkable accuracy, the effect of LD on both ICU cases and deaths. As I mentioned in my reply to Gavin L, while I’d found Ferguson’s predictions to roughly agree with what’s happened with a back-of-an-envelope estimate, Clive Best seems to have run the model with the actual conditions of lockdown and vindicated F’s results.
Of course that might be coincidence: there may be some reason other than LD why infections and deaths took the path they did. But AFAIK, so far no such at all convincing alternative has been proposed. Until such an alternative appears, it seems reasonable to believe that, since reality turned out to match F’s predictions for what would happen under LD, F has a good model for how C-19 spreads.
David R: “The fact that peak infections appear to be before full lockdown tells me that our lockdown was an overreaction.”
Possibly but the reason that the peak of infections seems to be before full LD was that people were already voluntarily “socially distancing”. Now how far that would have gone of its own accord is hard to know but we do know that with “full LD” the NHS was (just) able to cope and that R0 went from ~2.5 to ~0.8. But what that means is that ~two thirds of social connections were severed (2.5 to 0.8) and that amount of social disconnection was necessary to get R0 to 0.8. Any alternative would need some different method of breaking two thirds of connections. One way or another, to get R0 down, it had to be done and the result would have been similar in terms of the economic effects. It isn’t possible to reduce social contacts by such a large amount without a very big fall in GDP.
“High Consequence Infectious Diseases group had lowered the risk of Covid-19 to no longer a high risk on 19th March.”
I saw that at the time and meant to follow-up. Any idea what the criteria for “high risk” are and whether anything has changed since?
“Lockdown could have been used on the populated hotspots and just some sensible distancing, plus hand washing, and not touching your face elsewhere.”
Possibly, but the problems with policing a supposedly uniform national lockdown have been significant. It would have been far more difficult to manage with geographical variations. Also, the economic damage would probably have been similar as enough people in the “soft LD” areas would start to behave as they saw people in “hard LD” areas doing and loudly insist that their neighbours should do likewise. So a “local LD” could in principle have been done but at the cost of a lot of anger and resentment and probably not a great deal of benefit as people in “soft LD” voluntarily mimicked those in “hard LD”.
“small correlation between lockdown or no lockdown and outcome,” I don’t think there’s any data to show this except for countries (e.g. Taiwan, S Korea, HK) which took radically different approaches which were only possible with years of preparation. When March arrived, Europe had no such preparation.
The only significant European country which supposedly didn’t LD is Sweden. In fact Sweden had an imposed “soft LD” to which people voluntarily added all the breaks in the social network necessary to get R0 below 1. From what I’ve read Sweden’s GDP is forecast to have much the same fall as the rest of the European countries.
David R: “I remember the flu epidemic of 1968/69 – 80k deaths, including a lot of children. I said to a friend recently that we didn’t trash the economy”
I hadn’t really looked in detail at HK flu. The comparison to recent events is useful.
HK flu came in two waves, in 67-68 and 68-69. In the first wave, the peak of deaths per week assigned to influenza was apparently ~1,000. It rapidly rose from and fell to a couple of hundred. The outbreak lasted for a couple of months.
The second wave lasted for ~4 months and never got much beyond ~100 deaths per week.
So allowing for the increase in population, the peak mortality rate due to C-19 was ~2-3 greater than HK flu. But the C-19 rate was achieved only because of what’s widely thought to have been a severe LD. Without that the rate would have been far higher – more than 50,000 deaths per week was quite likely.
JImW: “Lockdown was meant to give enough time for NHS to get more facilities to deal with the explosion of cases. Not for the reasons put forward in this paper which are now used as a post rationalisation.”
I’m not sure what you mean by “this paper” but, assuming you mean my blurb, LD wasn’t really to give time for the NHS to get more facilities. It was so far below being able to cope with the un-locked down peak (the NHS had less than 3% of the likely number of needed ICUs) that the peak had to be utterly flattened as there was no way to increase ICU numbers to that extent. Now while Ferguson’s prediction was that the NHS would cope provided LD was in place, it wouldn’t be by much and obviously there was uncertainty in the prediction. So the time after LD began was used to add on ICUs etc in case reality exceeded prediction. In the event the prediction of peak ICU case numbers was correct to within a few hundred.
I’m not sure what reasons you think are “post-rationalization”. If you mean the number of deaths, well given an IFR, that follows from the number of infections. As I say in the article, the aim of LD was to reduce the number and peak of infections by severing ~two thirds of social links with consequent reduction of deaths. I think that’s clear in F’s paper and in what I say so I don’t really see what’s post facto about this.
“the attempt to try to say Sweden and Japan are somehow on a different planet is also just ‘spinning’ to cover up the clear message they give.”
As I said, Sweden had a combination of an imposed “soft LD” supplemented by voluntary social distancing which, de facto, reached much the same levels as in other Euro countries. That’s not yet certain but estimates of the fall in Sweden’s GDP are similar to those of other countries, indicating that a similar level of disconnection was reached in all countries. Further evidence is that the post-peak R0 is similar in Sweden and all other countries, again indicating a similar disconnection.
I haven’t looked much at Japan but it’s worth noting that they did have a “soft lockdown” and similar pressure to that in Sweden from the authorities to socially distance, That combination, together with different social conventions, may have been sufficient. Dunno – Japan does look very different but may turn out to have reached the same end state as everyone else by more “voluntary” pressure than compulsory.
“Europe in general is on or below trend, its over.”
A key assumption of F’s model is that C-19 maintains a constant R0 and IFR. If the virus mutates or for some reason its R0 is changed, then the predictions in F’s paper for what comes after this LD will likely fail. F envisages a sequence of impose LD – remove LD – impose LD, continuing for the foreseeable future. The next LD would be triggered by ICU case numbers exceeding some value. What will be interesting – and a test of F’s assumptions – is whether, after LD, the ICU case numbers again start to rise. The hope is that the fall-off in C-19 has been due to some means other than LD (although in all cases roughly coinciding with LD and as predicted by the proponents of LD) and so it won’t recur when LD is removed. That would undeniably be a good thing, although hindsight may then make Ferguson’s predictions seem alarmist whereas at the time no epidemiologists seem to have convincingly contradicted them.
“You cannot justify lockdown, or more properly martial law, and destroying people’s lives for this crazy overreaction to a virus.”
Well, you can if the alternative was worse. The evidence is that F’s model was, FAPP, correct in its predictions of what happened under LD. Without LD, there was therefore a prospect of ~500,000 extra deaths in 2 months for C-19, combined with the collapse of the NHS leading to many other deaths. As I mentioned elsewhere, that would have meant a death toll of roughly the same level as the first morning of the Battle of the Somme, each and every day for 2 months. No government who allowed such a thing would have survived long.
If you’re suggesting that voluntary methods would have achieved the same result, that’s possible in principle but it would only have had the same effect on R0 if people chose to do much the same things they’ve been obliged to do under LD. So the same economic and social damage would have been done.
@Rick, David R, JimW, Paul Dennis, Sean Lydon…..
+1
@Sean Lydon
+1
Why was this lockdown sceptic’s video removed from YouTube?
https://www.spectator.co.uk/article/why-was-this-lockdown-sceptic-s-video-removed-from-youtube-
Wuhan Virus: Global Epidemic, Pandemic? No
Started mid Oct 2019, now in Month Seven and
Global Population ~7.8 Billion – 7,800,000,000
– May 05, 2020, 17:48 GMT – Wuhan Virus Global Deaths 255,595 (~0.003%)
– May 10, 2020, 17:37 GMT – Wuhan Virus Global Deaths 282,516 (~0.003%)
– May 24, 2020, 18:25 GMT – Wuhan Virus Global Deaths 345,536 (~0.003%)
@Simon
The question is not: Do lockdowns work?
It’s: Is the damage caused by lockdowns worth the reduced delayed deaths?
UK peak day was 980 with Covid-19 on 10 Apr. Friday 22 May 2020 was 351
On 10 Apr the cost to UK economy/people was £2,551,020 per death
On 22 May the cost to UK economy/people was £7,122,507 per death
Given vast majority of deaths were over 65 each would never have contributed £2,551,020 to UK before dying of old age. In fact, vast majority do not contributed £2,551,020 to UK from birth to death.
Furthermore, NHS values one year of life at ~£30,000 and that’s for the few that are ill, much less if all ill. Using this with an 80 year life gives £2,400,000
Thus, lockdown has not been worth the cost and has not “worked”. Your support for lockdown is misguided as you only consider positives
Finally, average all cause deaths in UK is 1,650 per day and we’ve never been concerned about it
Paul Dennis “The data are very well fit by a Gompertz distribution across 80 days.”
This is true for almost any epidemic disease. It happens because there is a switch from an Rt (the value of R as a function of t; it’s the product of R0 and the susceptible fraction of the population) greater than 1 to a value of less than 1. For unmitigated spread with constant R0, this happens because Rt falls due to the decrease of susceptible population. For mitigated or suppressed spread (as for example due to lockdown) this happens because R0 is decreased by the mitigation/suppression measures. In either case you get a “Gompertz” curve.
“The epidemic never was exponential”
No epidemic is ever genuinely exponential. As soon as the epidemic starts, Rt starts to fall (due to the susceptible fraction falling as people become infected). Your chart shows this process for UK and Sweden but, as I said above, this is standard for an epidemic with falling Rt and doesn’t tell you the cause of the fall in Rt.
“I conclude that the lockdown in England had no impact on the trajectory or dynamics of the infection.”
I don’t think your grounds for this conclusion are very strong. As I’ve said in various other responses, the “soft” compulsory lockdown in Sweden combined with voluntary social distancing, led to the same effective result as a compulsory hard lockdown. The evidence for this is, first, that Sweden’s post-peak R0 is very similar to the UK’s, and, second, that Sweden’s GDP has been forecast to fall by a very similar amount to formal hard lockdown countries. These both show that societal connections have been broken to much the same degree.
“It will be interesting to do the same analysis for the other countries in Simon Anthony’s discussion if the raw data is available.”
As I said above, this will confirm a switch from Rt>1 to Rt <1, but won't tell you what the reason was. As the people who modelled lockdown predicted accurately the effects of LD, I think they have a prima facie case for claiming that they have a good model and that LD worked as intended (at least as far as suppression of C-19 is concerned).
Pcar:
“The question is not: Do lockdowns work? It’s: Is the damage caused by lockdowns worth the reduced delayed deaths?”
In the abstract, in some sort of timeless utilitarian cost-benefit analysis, what you way may be correct. However, we live in real time and had C-19 not been stopped from spreading, demand for NHS ICU services would have been more than 30x greater than it was able to supply. It would have collapsed quickly and completely. Deaths from C-19 would have been about 500,000 over 2 months, to which would be added at least 10s of thousands of otherwise preventable deaths due to the failure of the NHS. Mortality would have risen over those 2 months from ~80,000 to ~90,000 normally, to between 600,000 and 700,000, No democratic government would have survived a policy which led to that result. Nor would civil society. The result of such a situation could have been collapse of government and breakdown of law and order, on top of a pandemic and a disintegrated NHS. I don’t know what damage that situation would have done to GDP, but I suspect it would be at least of the same order as that caused by LD. In practice it would probably have been far worse because of the breakdown of order and difficulty in its restoration. At least under LD, the structure of society is still roughly in place, although rickety here and there.
“Your support for lockdown is misguided as you only consider positives”
Not at all. I’m aware of the likely scale of the costs of the consequences of lockdown and also of those of no lockdown. Either was likely to lead to a big fall in GDP of a similar amount. The difference is that, in the case of no LD, the rapid and complete collapse of the NHS due to a tsunami of incoming cases combined with an increase in mortality by a factor of seven or eight, would have provoked a political crisis and the breakdown of civil order.
As others have said, much the same ultimate loss of life will occur, LD or no LD.
I argue that much the same loss of GDP will happen, LD or no LD. So perhaps avoiding a political and civil crisis was the strongest reason for lockdown.
Great article, But I think there is a piece missing in all these analyses. We need to ask why there are certain situations (and certain situations only) where very high numbers of fatalities occurred. These specifically being Wuhan, Lombardy, Madrid, London, Belgium, NYC and now Brazilian urban centers. A set of specific circumstances allowed for the creation of a significant period of time between the virus entering the population and lockdown occurring. It seems to be about 8-10 weeks. That period allowed for high case density exponential growth and non protection of the elderly. I believe that the populations in these places did not wash hands, wear masks, protect the vulnerable etc until it was “too late” to prevent the large numbers of old people from infection and corresponding death counts. A situation exacerbated in some places by placing Covid patients into care homes which often saw >50% of the deaths associated with these early image outbreaks
The reason we don’t see this everywhere is because the images of the elderly virus deaths becoming a reality prompt the other parts of these populations to rapidly embark on those simple measures in time to prevent that exponential rise in cases and exposure to older people,
All Asia saw what happened in Wuhan and acted as one to behave differently. Which is why and Chinese New Year there wasn’t the explosion of cases in all thes eother cities. I remember being in KL airport in mid January. EVERYONE was wearing a mask. But not in the West. It was only when images of Lombardy hit our screens did we start to change behaviours. Once these images became real all of Europe changed. Maybe a little too late for Madrid and London. But not the USA. They were not influenced by what they saw in Europe – it was too far away. It was only after NYC delivered the catastrophic images that the rest of the USA changed behaviours. And now the same for South America. India and Africa have escaped due to the very low average age.
So my conclusion is the areas of high elderly death densities occurred where there was enough time, population density, and no change of behaviours until too late. The lockdowns were effective but unnecessary as societal behaviour changes had already kicked in – masks, hygiene, elderly managing their risk profile etc etc.
Good comments especially from Gavin L, but for some reason you can’t reply. Perhaps Hector’s finally enforcing social distancing rules having been bought off by CCP/WHO/Bill and Melinda G? – it’s hard to know for sure but that’s my hunch in the absence of a better theory.
What I can’t fathom re Simon A’s position is:
1. How does confining younger people 0-65 who are at no risk from perishing prevent older people from contagion whom they’d never come into contact with? Why not just confine the vulnerable? I can’t see the logic. I’m against any such restrictions myself regardless because I’d sooner be free to roam and chance a viral infection than be guaranteed ‘health’ in confinement, but that’s by the by.
2. What does ‘NHS fail’ mean? I’ve had an NHS hospital and a dental appointment cancelled until further notice. Neither were urgent thank God. But the dentist told me they’d been instructed to close. By what rationale does CV-19 automatically take precedence over other ailments such that not treating CV-19 alone constitutes ‘fail’? It makes no rational sense to speak of ‘fail’ where there is no criterion for ‘success’. Again it’s a typically emotive use of language re Our NHS in the service of various interests converging around ‘lockdown’ / police state. NHS ought to be in the service of the sick not vice versa, – NB I’m not suggesting you personally are deliberately using emotive language, only that such language is characteristic of any discussion re NHS.
Presumably the NHS ‘failed’ on any number of previous occasions when respiratory virus fatalities were at comparable levels even when there was no political motive for attributing the death to that cause? But no one noticed, respiratory virus deaths being universally ignored as usual. Except in 1968 when there were indeed some ‘Hong Kong Flu’ headlines which I’m old enough to remember. I repeat the words of Dr Wolfgang Wodarg ‘The emperor has no clothes’. If it weren’t for the fearmongering propaganda no one would have noticed CV-19 anymore than those previous anonymous viruses which for whatever reason suffered a deficiency in “news value”.
@pcar
“Finally, average all cause deaths in UK is 1,650 per day and we’ve never been concerned about it”
Good one and thanks for the name check. Why is it supposed to be worse to expire from a respiratory virus than from a stroke or cancer? And if it’s not, why the fuss about perishing from the virus specifically? The only sense I can make of it on the part of ordinary people is getting off on the alarmism and license for pointing the finger and shaming others. Once we take sides politically the facts soon disappear from view.
@John Church
John, this is a study from International Journal of Infectious Diseases which I discovered at the beginning of ‘lockdown’ when people were screaming about Italy, showing that there was nothing unusual about high flu season mortality rates other than the reporting of them. Professor Sucharit Bhakdi of University of Mainz made the same point in an interview available on YouTube.
https://www.ijidonline.com/article/S1201-9712(19)30328-5/fulltext
Simon, does Ferguson’s paper factor in the increase in NHS capacity through the use nightingale hospitals, use of private sector, retired staff returning to work, kicking old people out of hospital into care homes, stopping many appointments, and people being too scared to A&E?
One interesting point from Clive Best’s article is that Ferguson’s original paper specified R=2.4, but the published code has R=3.0. Since the original code that Ferguson’s team ran hasn’t been released, we don’t know if the R figure in the paper and the code were the same.
For anyone interested in Best’s article, you can find it here:
http://clivebest.com/blog/?p=9521
I think it’s a waste of time to be debating whether the lockdown has worked. We do know that the lockdown has trashed the economy and ruined countless lives. Many previously successful small businesses will have already gone to the wall. The ubiquitous chains will completely take over our struggling highstreets and we might as well continue to buy everything from Amazon – more choice, no queues, masks or parking charges.
The question that most needs to be asked right now is is why the hell are we still locked down? We know who the vulnerable are and we could protect them – or at least give them the choice to be free or cloistered. We know the 2m rule is idiotic and preventing businesses and schools from reopening. The sudden decision to quarantine arrivals 10 weeks after the event is bizarre at best.
We need to be clamouring to get the country functioning again, not hotly disputing something that can wait till we have some unfudged figures to analyse. Lockdown did or didn’t prevent the NHS from being overwhelmed several weeks ago. Time to move on now please.
Sean Lydon, you are spot on. The relevant debate right now is political and concerns our freedom. It has nothing to do with health measures.
Sean Lydon
“How does confining younger people 0-65 who are at no risk from perishing prevent older people from contagion whom they’d never come into contact with? Why not just confine the vulnerable? ”
As I think I mentioned in the original piece, Ferguson modelled this scenario (SD older people only) and the result was an improvement to ~250,000 to 350,000 deaths over 2 months with a proportionate fall in ICU. Still far too high for the NHS to cope with (15 – 20x capacity) and a mortality rate of ~approximately 5,000 per day “excess deaths”, so 4x as many people would have dies each day than is normal. Or, to make another comparison, close to two 9/11s every day. Again, no democratic government could have seriously contemplated such a thing.
“What does ‘NHS fail’ mean?” Sorry if that was too informal. However, as I mentioned several times here and there, what it means is that the NHS would have required more than 30x its then current ICU capacity (~180,000 places at the peak). In addition there would have approximately 3x as many people hospitalized as entered ICU. There were ~140,000 beds in total available in the NHS so overall hospital capacity would have had to be approximately quadrupled.
” the NHS ‘failed’ on any number of previous occasions when respiratory virus fatalities were at comparable levels”
The NHS has never faced anything remotely comparable to the number of critically ill patients and dying patients that an unsuppressed C-19 outbreak would have led to. At the peak of HK flu, there were 1,000 deaths per week. At the peak of C-19 – with a lockdown – there were ~6000. Without LD, there would have been more than 50,000 deaths per week with a proportionate hospital in-patient demand. There’s no relevant comparison to any previous respiratory virus outbreaks in the UK.
“If it weren’t for the fearmongering propaganda no one would have noticed CV-19”
I believe that people would have noticed an increase in mortality from ~1,600 to ~8,000 per day so I assume you’re disagreeing with Ferguson’s model. The model’s predictions for the unmitigated outbreak follow directly given its R0 and IFR and it accurately predicted the mortality rate following LD, So I’m not quite sure why you’d think it seriously wrong. But if you don’t think it’s wrong, I don’t see how you can also think that “no one would have noticed CV-19” as an extra year’s worth of deaths over 2 months would certainly get most people’s attention.
“does Ferguson’s paper factor in the increase in NHS capacity through the use nightingale hospitals, use of private sector, retired staff returning to work, kicking old people out of hospital into care homes, stopping many appointments, and people being too scared to A&E?”
No but these were fairly ad hoc measures on which Ferguson couldn’t rely when making his forecasts. . All these things helped but in a relatively small way. For example, the total number of “Nightingale” beds would have been less than 15,000 and these wouldn’t have been ICU beds, just beds with mobile ventilators moved between them as needed. ~33,000 NHS beds were also freed up by sending patients home. Again, these weren’t ICU beds. The private sector (it’s claimed) made ~1,200 ICU beds available and (it’s also claimed) that ~2,500 new NHS ICU places were created, on top of previous capacity of ~4,000.
So, in rough figures, as a result of hectic preparation and all those various measures, there were fewer than 10,000 ICU places available, which also had to cover “normal” ICU requirements (against a prospective unmitigated demand of ~180,000) and perhaps 50,000 to 60,000 beds (against a … of more than 500,000 incoming C-19 patients at the peak).
There really wasn’t any chance the NHS would withstand being outmatched to such an extent.
Cheezilla: “I think it’s a waste of time to be debating whether the lockdown has worked”
I disagree, The aim of LD was to reduce NHS demand and deaths. It hasn’t got rid of the virus. There’s every prospect that, as LD is loosened, infections start to climb again, leading to the prospect of LD tightening. If the process is to be repeated it would be a good idea to learn from the first time what worked and what didn’t so, if it has to be done again, it can be done better.
Simon Anthony – apologies for not getting back before – there is just too much stuff for the locked down retired to do!! Been out on the bike today 40 miles in a rural county where thankfully, I detect, people have stopped jumping in hedges to avoid some old bloke coming within 5 metres. There seems to be a dawning realisation that it isn’t the Black Death.
The HCID matter you mentioned Simon. I have no idea what their criteria are although there are details on links from this page – you will note that the last update was 21 March??!! There is an explanation of why it was downgraded. I assume that they could zoom if they thought it necessary – I don’t know.
https://www.gov.uk/guidance/high-consequence-infectious-diseases-hcid#status-of-covid-19
I did see a comment (heavens knows where) back at the end of March, just after the lockdown started, from somebody who was rather concerned that all of a sudden a virus that had been downgraded by the HCID group was now the “Black Death” a few days later. Another commenter suggested that it was downgraded because infections had peaked and were falling. Peak deaths of course were around 8th April, though it took a long time for somebody to admit it.
An interesting point (IMHO) is that I have seen it stated (and I don’t know the truth) that Prof. Ferguson is on both the HCID committee and of course SAGE? The timeline is interesting – perhaps he wasn’t available for the HCID meeting?
The killer for a simple man like me (and I used model output a lot back in the day) is that the IC model has to demonstrate consistent results (yeah right, as they say) and Prof F’s does not do that as others have pointed out, even with the same inputs. There is the joke about the chimpanzee and the typewriter – if he bashes away long enough eventually he would produce the Bible. The fact that Sweden’s data was put into IC’s model and gave an answer 10 times too high!?. I always found modellers loved their models and never obeyed Richard Feynman’s first principal – don’t fool yourself.
Thanks for the article Simon – it helps to get us a little nearer the truth.
Simon Anthony: Lockdown achieved its purpose weeks ago and reduced NHS demand – although this was actually achieved by killing off a load of the frail and elderly by refusing them essential medical treatment.
However, there is now an enormous backlog of operations and treatments that were put on hold with a resultingly enormous waiting list. How is the NHS going to cope with that?
The current stats suggest very strongly that there won’t be a need to lockdown again – there isn’t even enough virus about for AZ to develop the vaccine. Meanwhile, the country needs to be unlocked pronto.
Dene Bebbington: Sorry, I meant to respond to this earlier… “One interesting point from Clive Best’s article is that Ferguson’s original paper specified R=2.4, but the published code has R=3.0”.
That’s unlikely to be a “smoking gun” in that the paper considers a range of R0 from 2 to 2.6 and shows the results are insensitive over that range: the NHS “fails” (if you’ll forgive the weak term – falls apart would probably be more accurate) comprehensively across the whole range.
But again, given R0 of more than 2 and an IFR of ~1%, you don’t need F’s model, or anything at all subtle, to work out what’s going to happen.
Simon, I did not say because it was a Gompertz curve that lockdown was ineffectual. I fully expect had lockdown to have been effectual to have resulted in a Gompertz type distribution. I pointed out that the dynamics of the epidemic have remained constant throughout the 1-80 days record we have now. Peak death rate occurred on the 8th April implying a peak infection rate on the 17th March before lock down. Thus Rt was declining well before lock down and was probably below 1 before lockdown. The rate of decline of Rt did not change at the point of lockdown which, translated to the death curve occurred somewhere around the 12th April. This point is indicated in the plot. I also indicated that Sweden and the UK have virtually identical dynamics. Whilst Sweden might have had a soft lockdown it is very different to ours.
I don’t buy your post that the lockdowns are similar and the GDP argument is not a strong one. Sweden’s GDP is going to be impacted very significantly by its trading neighbours internationally rather than by its own internal market dynamics.
I am intrigued that two countries with different extents of social distancing (Sweden did not have a lock down policy as such), different overall population densities have produced an epidemic dynamic that is effectively identical but scaled by the populations. In fact I think this latter point is very telling.
Occams razor tends to point me in the direction that lockdown in the UK had no effect, possibly because it came too late. I can’t comment on other western European countries because I haven’t done the analysis but I would be surprised if they are very different to Sweden and the UK. Most are all ending up at a very similar number of deaths per million population within a factor of 2.
It seems to me that many are looking for evidence that lockdown has worked and I have yet to be convinced by any of the data I have seen so far.
David R: “The fact that Sweden’s data was put into IC’s model and gave an answer 10 times too high!?”
I saw a tweet from Clive Best from a few days ago which said something to that effect. I found it hard to understand how the same model could have got the UK prediction more or less spot-on but have got Sweden so wrong. No more details appeared on his website which made me wonder whether all was as it first appeared.
Today there’s a post which says that under a UK-style LD, Sweden’s mortality would have been ~a thousand deaths fewer than they’ve actually experienced. As I’ve been boring on about for a few days, I think that Sweden’s LD, although partially voluntary, was of only slightly less severity than the UK’s (evidence is the level of R0 reached in Sweden after the peak was very slightly higher than the UK and predictions for GDP fall in Sweden are slightly less bad than for the UK). So I think (if I’ve understood CB correctly) this is another successful prediction for Ferguson’s model.
Simon, another way to look at the problem is to take the mortality data up to the point of lockdown. The first death reported by NHS England was the 1st March and lockdown was on the 23rd. By this time it was clear that the data was following a Gompertz function and it was possible to give estimates, albeit with a degree of uncertainty, to the Gompertz time variables and fit the data to estimate the maximum number of deaths. I’ve looked very quickly at this and get a central estimate of about 42000. This is a little higher than the final England number which I expect to be close to 30,000. However, I am almost certain that the final number will come within the uncertainty band associated with the first estimate of the Gompertz parameters. That this number is close to the final one suggests strongly to me that Lockdown has not had any significant effect. It certainly shows that the NHS would not have been overwhelmed and that in terms of total deaths we were looking at the upper end of excess mortalities associated with flu epidemics that we have had in the past. None of these required a lockdown.
This forward projection could have been done every day after lockdown and it would have become clear that the central estimate was not changing significantly and the uncertainty in the estimate would be reducing. After 3 weeks the picture would have been very clear. Our central estimate remained similar to our first guess albeit now after the peak of deaths with a very much better constrained uncertainty band. To me this is good evidence that lockdown was ineffectual.
Paul Dennis:
“Peak death rate occurred on the 8th April implying a peak infection rate on the 17th March before lock down. Thus Rt was declining well before lock down and was probably below 1 before lockdown.”
Yes, I think that’s right. However, my interpretation is that people had begun socially distancing well before LD in both the UK and Sweden. Although LD has a nominal particular date attached to it, in practice it took place over several days. For example (I realise this is mere anecdote but I suspect that others had similar experiences) I was in the centre of Oxford 3 days before LD and it was almost deserted; a cafe normally packed with more than 50 people had me and one other informally socially distanced man as customers.
Also, when working out the date of peak infections from that of peak deaths, you have to take account of the distribution of infection-death periods, not just the average. A chap on “More or Less” a couple of weeks ago explained in outline what’s involved. His view was that. when the calculation was done properly, the peak of infections coincided well with the nominal LD date.
“the GDP argument is not a strong one.” On its own, I agree but the similarity of the estimated R0s is such that Sweden seems to have reduced social contacts to much the same level as the UK which would lead one to predict that its GDP would be similarly affected. And yes you’re right, it will be affected by the LDs elsewhere but in that case it’s suffering a big impact to GDP while also (because its LD failed to prevent C-19 getting into care homes) having much greater mortality than its Scandinavian neighbours which seems to give it the worst of all worlds.
“I am intrigued that two countries with different extents of social distancing (Sweden did not have a lock down policy as such), different overall population densities have produced an epidemic dynamic that is effectively identical but scaled by the populations. ”
I don’t think they did. Sweden has an R0 of ~1.6 leading up to its peak; the UK had ~2.5. These are very different. I’d guess that they differ precisely because of the reasons you mention.
Regarding Occam’s Razor, I’d say that the simplest explanation for what’s happened is that all these countries had similar lockdowns, with similar results. Ferguson’s model of the LD, both for the UK and Sweden, predicts results very similar to what’s occurred. So there’s a theory, turned into a model, from which predictions were made, predictions were tested against reality and were found to be sound.
I think you’re suggesting that, rather than LD, some other limiting mechanism stopped the spread of C-19. Of course you could be right (I hope you are) but we should soon find out as, if LD was the cause of the decline in infections, when it’s loosened, Infection numbers will rise again. If the virus has really died off, then they won’t. If R0 is at that stage as it was before LD, it will take no more than a few weeks for infection levels to return to what they were before LD.
“It seems to me that many are looking for evidence that lockdown has worked”
In my case at least, that’s not so. I was initially sceptical of Ferguson’s model and its predictions. As a result of trying quite hard to find weaknesses and alternative explanations I’m now sure that the model is sound and will generally make good predictions. That said, it doesn’t pretend to be able to predict the evolution of C-19 so if the virus mutates as part of its “normal” life cycle then the model won’t have included such a process. Perhaps, if we’re very lucky, like the Martians in “War of the Worlds”, C-19 has fallen prey to another bug.
Simon, ‘That’s unlikely to be a “smoking gun” in that the paper considers a range of R0 from 2 to 2.6 and shows the results are insensitive over that range: the NHS “fails” (if you’ll forgive the weak term – falls apart would probably be more accurate) comprehensively across the whole range.’
I don’t consider it to be a smoking gun, it’s just curious that the paper has different R values to the published code. Of course, it could just be that they’d been modelling R=3.0 when the code was made public.
Having trouble trying to post.
@Simon Anthony
Astounding arrogance to repeatedly claim you know, without doubt, what future would be
These doom mongering certainties have not happened anywhere regardless of level of lockdown from none to total
Reasoning with one whose mind is so indoctrinated and closed to reality & empirical evidence is futile
@Sean Lydon
Dentistry in UK has ceased, we’re back to C18 extractions only same as barbers and black-smiths offered
Yes, AGP procedures pose a risk, but they’ve never been banned before during any SARS or other virus eg HIV. Risk mitigation could be achieved with use of dental dam and high volume aspiration
+100 spot on
@Cheezilla
+1 Agree
This has been a really interesting discussion. The main take-away is that our Betters will point to analyses like Simon Anthony’s and conclude — “Lock Downs Work!” The lessons they will draw from this experience are (1) the peons grumbled, but took it; and (2) we should impose Lock Downs on the peons earlier. Make no mistake about this — our Betters have done this once, they will do it again.
No disrespect to Mr. Anthony, but I personally do not find his analysis convincing. Nor do I take comfort from his stamp of approval for Prof. Ferguson’s model. It looks like logically correct extrapolations from an incomplete description of the system.
The analogy is with the Anthropogenic Global Warming Scam, where the models must predict that increased CO2 will lead to runaway global warming because the models fail to include properly all the other physical processes (eg cloud formation) which act to mitigate the warming. Le Chatelier’s Principle, and all that.
However, just as the demonstrated failure of models has done nothing to shake the neo-religious fervor of the AGW crowd, we should anticipate that the official belief will be that Lock Downs worked, saved the NHS, saved hundreds of thousands of lives. And any academic who presents an analysis contrary to our Betters’ received wisdom can likely kiss goodbye to his career.
“How does confining younger people 0-65 who are at no risk from perishing prevent older people from contagion whom they’d never come into contact with? Why not just confine the vulnerable? ”
Simon, thanks for the considered response. My question was how a quarantined group could contract the virus if they never came into contact with others? I can’t understand the need for universal confinement rather than just confining those whose contact with the virus could prove fatal. If the vulnerable group are effectively isolated, why do the others have to stay in their homes? Why does it matter where they are?
The point about ‘NHS fail’ relates to the priority accorded to CV-19 victims over others. Why should media/officialdom determine NHS priorities? Other afflictions haven’t suspended themselves in the meantime. Surely decisions should be made on the medical needs of the individual patient not on the genus of their ailment? There’s no reason to assume that CV-19 victims are more in need of treatment than others. Its effects in any individual case will depend on any number of factors.
Another comment of yours I wanted to question:
*As I mentioned elsewhere, that would have meant a death toll of roughly the same level as the first morning of the Battle of the Somme, each and every day for 2 months.*
They were healthy young men in the Somme rather than elderly in care homes and at death’s door, not just on account of age but “co-morbidities”. Respiratory viruses typically take out the ailing and aged every flu season. When did 80 year olds’ passing away ever compare with 20 or 30 year olds taken in the prime of life?
The very notion of viewing “deaths” indiscriminately regardless of age is quite absurd and must be so long as death is guaranteed, the human mortality rate remaining at 100%.
This simple truth has been falsely misrepresented as “utilitarian”. But value doesn’t consist in utility alone. I valued my father’s life because he was my father. When my newly married 32 year old brother-in-law perished in a motorbike crash the family grief was indescribable.
When my father eventually passed away 2 years after a debilitating stroke the mourning was of a different order: he was *80*. There’s no comparison. Nothing to do with utility but the ineluctable reality of the human lifespan, which we’re supposed to deny in the face of sanctimonious political bullying in the name of ‘Our NHS’ / “Saving lives”.
Anonymous: ” By this time it was clear that the data was following a Gompertz function and it was possible to give estimates, albeit with a degree of uncertainty, to the Gompertz time variables and fit the data to estimate the maximum number of deaths. I’ve looked very quickly at this and get a central estimate of about 42000. ”
I don’t think it was “clear” that deaths were following a G curve. You can certainly fit G curves to the data, as you could fit many others. But you’d just be fitting the parameter values so as to get a good match and without any compelling prior reason for those values.
The data are uncertain: you don’t know for sure how many of those diagnosed as having C-19 actually did so; you don’t know how many people died from C-19 but weren’t diagnosed as such; as the disease is so new, you don’t even know how uncertain those estimates might be.
So yes, you can fit a Gompertz curve (or any number of other curves) to those points but the uncertainty in the prediction of the eventual death toll can be huge. You may (with hindsight in an estimate done more than 2 months after LD) get an estimate of 40,000 or so deaths. With quite minimal uncertainty on the mortality data to 23 March, you can also get a good fit which leads to 400,000 dead before the end of June. As decisions had to be made well before that date, even more widely varying predictions would fit the data. It simply wouldn’t have been possible to make a robust, credible prediction before LD as to how things would develop on the basis of curve fitting.
“This forward projection could have been done every day after lockdown and it would have become clear that the central estimate was not changing significantly and the uncertainty in the estimate would be reducing”
This is currently being done via estimates of R0. The trajectory of infections and deaths is following what standard theory predicts for R0 having been reduced by lockdown to less than 1.
The real problem with G curve fitting is that it’s an ad hoc (or in this case post hoc) exercise without theoretical support, up against a model which is based on standard epidemiology, makes definite predictions, using parameters which can be readily estimated and interpreted within the framework of standard, well-understood theory, whose predictions have turned out to be sound. Of course the model might eventually turn out to wrong, or at any rate inadequate, but I don’t think there’s any strong reason so far to think that’s the case.
Pcar: “Astounding arrogance to repeatedly claim you know, without doubt, what future would be”
Not at all; quite the opposite. I’m simply telling you what epidemiological maths says will happen. No need to make this stuff up; it’s entirely standard. If you think you know better than the maths, having improved on decades of epidemiological theory, well, please show your working. Or you could try and understand why epidemiology leads to the conclusions I’ve outlined.
Gavin L: “The analogy is with the Anthropogenic Global Warming Scam”
I’d been meaning to mention this, as it’s been lurking in the background with all this modelling talk. The contrast between Ferguson’s model and climate models is a good example of the old saw about all models being wrong but some being useful.
Various people say they’ve shown that F’s model makes predictions of numbers of deaths which can vary by, say, 20%. So let’s say that’s the error on his predictions. Climate models in contrast can apparently predict the temperature at the end of the century to within a range of, say 6 degrees. Now 6 degrees in ~288K is about 2%, so climate models may be far more accurate than Ferguson’s model.
Yet Ferguson’s prediction was useful in helping government to decide what to do because it was so far beyond the NHS’s capacity that it didn’t matter if it was 20% wrong: lockdown was needed. In contrast, the extremes of the range of temperature predictions from climate models can lead to radically different policies without any compelling reason to follow one rather than another.
Whereas F’s less accurate predictions radically simplified the decisions to be made, the more accurate predictions for global warming complicate and confuse.
Sean L: “My question was how a quarantined group could contract the virus if they never came into contact with others?”
In theory, yes, if you can find some way of identifying and completely isolating a vulnerable group then that would do it. But to make them secure you’d have to prevent any form of close contact with any other human being, possibly for the rest of their lives.
I’m not sure how they’d be cared for unless their carers were also isolated but in any case, I don’t think a government would contemplate effectively imprisoning its old and sick and waiting for them to die (because I think that’s how it would be portrayed).
And their numbers would be added to as other people got older and also became vulnerable. It wouldn’t be much fun waiting for your 70th or whatever birthday to come round, knowing that thereafter you’d be de facto imprisoned for the rest of your life.
“The very notion of viewing “deaths” indiscriminately regardless of age is quite absurd”
I agree; the Somme reference was to illustrate the scale of the number of deaths. I didn’t mean to equate the losses in other terms.
Simon A: “Now 6 degrees in ~288K is about 2% …”
Man, you are good! I doff my metaphorical hat. As many a statistician has noted, choose the right origin for your scale and anything can be made to seem minor.
Probably the analogy to choosing to predict global temperature as measured from Absolute Zero would be building a mortality model which predicted total annual deaths in (say) the UK — all +/- 525,000 of them. And then attempted to predict the annual number of incremental deaths due solely to the C-19 virus (i.e., deaths from, not with). And since we have the demonstrated observation of C-19 deaths being concentrated in those who are very late in life anyway, make the model reflect the obvious reality that many of those who die from C-19 would otherwise soon have succumbed to their co-morbidity.
If we did all of that, we would concluded that the percentage incremental deaths from C-19 is trivial — certainly not enough to justify building the unneeded Nightingale Hospitals wrongly predicted to be required by Fergie’s flawed model.
However, I concede the field, sir! Your side has won the debate for the hearts & minds of the Political Class. Now we will all have to live with the consequences.
Simon: “Not at all; quite the opposite. I’m simply telling you what epidemiological maths says will happen.”
The simple “IFR x percentage of popluation infected” equation will predict what will happen IF the assumed values turn out to be correct. Since we don’t know the counterfactual of no mitigation we don’t know if those assumptions were correct. Why are you picking 20% as your example of variance from the prediction? Some IFR estimates are as low as 0.1-0.2%, whereas Ferguson used 0.9% IIRC. I know there was limited data back in March, but that doesn’t mean we should take the higher IFR. Also, is there any evidence to suggest a SARS coronavirus could infect 80% of the population and still result in the assumed IFR?
As for Ferguson’s model, it may have roughly agreed with the simple equation above, but given that the code is reported to be buggy, it has 450 parameters which is 450 chances of a wrong assumption, and it has predicted significantly more deaths in Sweden than they’ve had, then there’s sufficient reason to be sceptical of that model. The fact that he hasn’t released the original code is telling .It wouldn’t take long to put it on GitHub and they had time to work with Microsoft to rewrite it, so I don’t buy the claim that they haven’t had time.
Simon:
“I’m not sure how they’d be cared for unless their carers were also isolated but in any case, I don’t think a government would contemplate effectively imprisoning its old and sick and waiting for them to die (because I think that’s how it would be portrayed).”
Why shouldn’t the carers be isolated too: why does *everyone* have to be? But this is disingenuous. The messaging has been consistent from day one and has never wavered: universal risk of deadly contagion. And that’s what people have picked up on. Even now about 70% going round in masks, even young children who are at no risk at all.
As for “that’s how it would be portrayed” – you mean plutocrat media systematically lie? Why can’t the truth be told about who’s at risk and who isn’t? Otherwise what’s the point of democratic politics in the first place? Reality is officialdom / media in political lockstep. Mutual recriminations premised on ‘Saving Lives’ assuming indiscriminate risk when the truth is most fatalities were elderly and already close to death.
Even if the measures could notionally prolong the lives of a few, decanting people from hospitals to care homes likely resulted in *more* abbreviated lives. Criticism of ‘lockdown’ / police state is marginalised or completely censored: a planned campaign of disinformation serving systematic demoralisation. Politically akin to ‘Climate’ Diversity / ‘anti-racism’ around which identical globalist interests have coalesced, epidemiology mirroring climatology, ‘models’ and all. Big Lie isn ‘t the half of it.
*I agree; the Somme reference was to illustrate the scale of the number of deaths. I didn’t mean to equate the losses in other terms.*
A grotesque analogy whichever way you slice it.
Gavin Longmuir
‘Your side has won …’
Perhaps not quite yet. There is the explicit (and testable) prediction about what happens when lockdown ends. We are about to see.
Gavin L: “the unneeded Nightingale Hospitals wrongly predicted to be required by Fergie’s flawed model.”
This is partly untrue. F’s model predicted that NHS capacity would be adequate if LD was imposed. But only just: there would have been very little headroom. Given the uncertainties, the government and various health authorities obviously shared your mistrust in F’s model and built the N hospitals etc.
As turned out (this is the part of your statement which I think is true) the N hospitals weren’t needed and the NHS coped, just as F’s model predicted.
“Your side has won the debate”
I don’t have a “side” in this debate. When I began looking at this I was at least as sceptical as you seem to be. I thought it was unlikely that Ferguson’s model could be so reliable as to justify lockdown. I tried to find the weaknesses in Ferguson’s model. At various times I thought I might have found something, but when I looked more closely and understood better, I realised that I was wrong.
Then I properly looked at the predictions that F had made; not the media Peter Hitchens/Toby Young versions or those you read in blog comments, but the numbers in the paper and the conditions under which they’d been derived. And I found that they were correct to an accuracy which, to me at least, seemed very good. At the same time I found that simple models and arguments gave very much the same results (worth mentioning that this may be another difference between F’s predictions and those of climate science – in the latter case, simple models tend to give much lower predictions for temperature rise. I’d find the predictions for AGW a lot more convincing if complex models weren’t needed to make them. If the effects were as big as predicted, it should be possible to understand the reasons and make simple, approximate but realistic models which show them clearly. I’m not aware of such models but maybe I should look harder.)
So a man has a model which he says can predict something and he makes a falsifiable prediction which tested and the prediction turns out to be correct. I think that’s how good science works and it tends to increase one’s Bayesian confidence that the model accurately reflects that part of reality which it’s supposed to represent.
I’d say that the side of science has “won” the debate, although it seems a rather Pyrrhic victory.
Dene B:
“Why are you picking 20% as your example of variance from the prediction?”
Because that’s the sort of size of the “errors” of F’s predictions that people claimed to have found by running F’s model and finding its predictions varied.
“Some IFR estimates are as low as 0.1-0.2%, whereas Ferguson used 0.9% IIRC. I know there was limited data back in March, but that doesn’t mean we should take the higher IFR. ”
It was the best available estimate based on Wuhan data, Any other estimate were based on small sample sizes in special and essentially incomparable conditions (e.g Diamond Princess which in any case I think had a similar IFR and R0).
“Also, is there any evidence to suggest a SARS coronavirus could infect 80% of the population and still result in the assumed IFR?”
I’m not sure what you mean here; do you mean has it historically happened? If so, I’d say the question should be: has there ever been a viral infection with an IFR of ~0.9% and an R0 of 2.4, or something similarly nasty? Viruses with such combinations are rare, obviously I suppose, so if you limit it to SARS coronaviruses there are very few examples to compare it with. If you extend to other viruses, the obvious earlier comparison is with Spanish flu, with an IFR of ~2.5% and a mean R0 of 2.0 (high enough to infect ~80% of the propulation). Of course most flus aren’t in that league, just as very few coronaviruses can match C-19.
“it has predicted significantly more deaths in Sweden than they’ve had”
Not according to the blog post on Clive Best’s website in which he shows that F’s model, under LD, underpredicts the number of Sweden’s deaths.
“The fact that he hasn’t released the original code is telling”
Not really; not unless you’re determined to find a “smoking gun”. I write lots of odds and ends of software and spreadsheets. In their “original code” they’re almost unintelligible to anyone but me because they’ve no need to be. But occasionally someone else might want the code or s/s and so I “put lipstick” on the pig’s ear (badly mixed metaphor) of my code. It still does the same things but in a way that others can understand.
“It wouldn’t take long to put it on GitHub and they had time to work with Microsoft to rewrite it, so I don’t buy the claim that they haven’t had time.”
AFAIK, they have had time, they have rewritten it (with MS), they have put it on GitHub and Clive Best used it to show that F’s model worked for both the UK and Sweden.
Sean L:
“Why shouldn’t the carers be isolated too:” I’m not sure how serious you’re being here because you seem to be suggesting that, along with the elderly and vulnerable, all their carers should also be isolated. According to an estimate I’ve just looked up, that’s another 8.8M people. You’d also have to isolate the medical facilities and staff and all other support services needed by all the isolated people. You’d also have to prevent all these people from seeing non-vulnerable family and friends, potentially for the rest of their lives.
You seem to be suggesting the incarceration of somewhere between 10M and 20M people. Either you’re not being very serious or you haven’t thought about the second, third or fourth order effects of what you’re suggesting.
“you mean plutocrat media systematically lie? ”
No doubt some lying involved but rather more laziness, ignorance, stupidity and an appeal to emotion rather than reason.
“Why can’t the truth be told about who’s at risk and who isn’t?”
I fervently wish that our “leaders” had the moral courage to talk frankly about the situation. Unfortunately, they’re so cowed by the media and twitter mobs that, even if they properly understand what’s happening, they’re frightened to talk about it.
“*I agree; the Somme reference was to illustrate the scale of the number of deaths. I didn’t mean to equate the losses in other terms.*
A grotesque analogy whichever way you slice it.”
Really? I was perfectly willing to gracefully concede on the analogy but since you don’t want to let it go: I think there’s a fairly strong analogy between WWI/Somme and a (hypothetical) unmitigated C-19 . In both cases, government would have failed to prevent the catastrophe and then failed to protect its people, insisting on going on with a policy leading directly to the deaths of hundreds of thousands.
So I don’t agree that the analogy is “grotesque” at all. Rather, I’d say that your proposal for imprisoning getting on for a third of the population and preventing them from ever again seeing their relatives or friends is rather more deserving of that characterisation. But as a greater man (or at any rate tennis player) than either of us repeatedly said: “You cannot be serious”.
Alan Kennedy:
“There is the explicit (and testable) prediction about what happens when lockdown ends. We are about to see.”
Quite right. And it will probably turn out to be wrong in some ways and so be improved to better predict what happens next. But I wouldn’t say that F’s model “predicts” another rise in infections; rather it follows immediately from the assumption that C-19’s R0 in a newly unlocked population will be much the same as in the pre-LD population.
As I’ve said elsewhere, no one can reliably predict the time and extent of a virus’s mutations to a different value of R0 or IFR, so in the absence of any contradictory evidence, unchanged values were the default assumptions. If it has changed, towards less aggressive values, then I suggest we all thank the deity of our choice because there’s no reason to think we should be so relatively lucky (that’s compared to the repeated LDs which would otherwise be needed).
Simon: “I’m not sure what you mean here; do you mean has it historically happened? If so, I’d say the question should be: has there ever been a viral infection with an IFR of ~0.9% and an R0 of 2.4, or something similarly nasty? Viruses with such combinations are rare, obviously I suppose, so if you limit it to SARS coronaviruses there are very few examples to compare it with. If you extend to other viruses, the obvious earlier comparison is with Spanish flu, with an IFR of ~2.5% and a mean R0 of 2.0 (high enough to infect ~80% of the propulation). Of course most flus aren’t in that league, just as very few coronaviruses can match C-19.”
I’m trying to understand where the 80% infection rate estimate came from and whether it’s based on other coronaviruses. The Spanish flu you mentioned is thought to have infected around a third of the world population, that’s less than half of 80%.
Simon: “Not according to the blog post on Clive Best’s website in which he shows that F’s model, under LD, underpredicts the number of Sweden’s deaths.”
I can’t remember the source (it may be the UnHerd interview) but I think Ferguson said that Sweden would have around 20k deaths if they stuck with social distancing and didn’t go for a legal lockdown.
Simon: ‘Not really; not unless you’re determined to find a “smoking gun”. I write lots of odds and ends of software and spreadsheets. In their “original code” they’re almost unintelligible to anyone but me because they’ve no need to be. But occasionally someone else might want the code or s/s and so I “put lipstick” on the pig’s ear (badly mixed metaphor) of my code. It still does the same things but in a way that others can understand.’
I’m not looking for a smoking gun, but am concerned about why Ferguson’s original code hasn’t been made public. Many programmers can attest to the problem of coming back to their own undocumented code and having problems understanding it. The situation is even worse if other people have to work on the code, which may well have been the case with Ferguson’s model. I’ve seen enough reviews of the published code to be concerned about programming standards in academia. This pleb would expect greater openness from people whose models are feeding into monumental national decisions.
Interestingly your response is similar to those I’ve seen by other academics who aren’t concerned about lack of good software engineering practice, and who are effectively saying we should take it on trust that academic software is properly tested.
@Gavin Longmuir
Spot on. They want Sweden to fail, ie want Swedes to die, to ‘prove’ LD was justified
Even if that doesn’t happen, any dissenters will be shut down – as Secretary of State Thérèse Coffey BSc was. Coffey is one of only two Science degrees in cabinet
.
@Simon Anthony
Mathematical models are just that, they are not reality or gospel
If they were all Fergusons previous “Will Happen” would have occurred, but they didn’t
Mathematical models are not God, but some worship and unsensationally believe and genuflect to Archbishop Ferguson
@Sean Lydon Wednesday 27th May 2020 at 00:14
Well said. Also old are frequently comfortable with knowledge they’re near end of life. C4 News stopped interviewing them as most weren’t in panic and said ‘So be it, I know I will die soon’
@Sean Lydon Wednesday 27th May 2020 at 11:38
“A planned campaign of disinformation serving systematic demoralisation”: In March Gov’t was concerned the public weren’t sufficiently scared and fearful and prompted MSM to induce fear in the public
Think about that, UK Gov’t wanted UK public in fear and panic
Delingpole: Gov’t wants fear of Covid-19 increased, media to play important part
Simon
“If it has changed, towards less aggressive values, then I suggest we all thank the deity of our choice because there’s no reason to think we should be so relatively lucky (that’s compared to the repeated LDs which would otherwise be needed).”
That sounds like a prediction to me. Absent “less aggressive strain” appearing by divine intervention I think the neutral stance demands the model predict endless lockdown. And if that turns out wrong (I agree with your surmise that it will)? It can’t be wrong coming out and have been right going in. Can it?
Interesting read, a good defense attempt, however…
“Models that curtail individual variation in susceptibility or exposure to infection overestimate epidemic sizes and herd immunity thresholds.”
Which leads to…
“…the herd immunity threshold declines sharply when coefficients of variation increase from 0 to 2 and remains below 20% for more variable populations.”
Here’s the paper:
https://www.medrxiv.org/content/10.1101/2020.04.27.20081893v3.full.pdf+html
But ultimately as noted in the comment above – models are just that. The reality, however, has been somewhat different especially for Ferguson’s approach.
Simon:
*I’m not sure how serious you’re being here because you seem to be suggesting that, along with the elderly and vulnerable, all their carers should also be isolated. *
It’s only the elderly / infirm who are at risk of perishing so why confine everyone even school children rather than those they come into contact with? And if they’re so unwell as to be incapable of taking rudimentary precautions for themselves, what on earth is the point of others suffering to prolong their miserable existence?
I’ve no more concern with confining people to extend the lives of the elderly than banning motorcycles which would undoubtedly “save lives”. Let’s not pretend that anyone is more bothered with the lives of elderly strangers now than in previous years when flu season deaths scarcely registered in the public domain. CV-19 is entirely political. How and why it became political is less clear. I quoted Dr Wodarg before: ‘The emperor has no clothes’. Why Dr Wodarg among any number of other ‘sceptic’ are marignalised even completely censored by plutocrat media only reaffirms the point.
“I fervently wish that our “leaders” had the moral courage to talk frankly about the situation. Unfortunately, they’re so cowed by the media and twitter mobs that, even if they properly understand what’s happening, they’re frightened to talk about it.”
Officialdom and media alike are promoting the alarmism. The mutual recriminations, blaming each other for CV-19 casualties are self-serving, presupposing the spread of viral infections to be in the gift of human agency, and by extension the responsibility of officialdom/medical nomenklatura and related interests, the truth about viruses erased from public scrutiny: dissenting, that’s to say disinterested, i.e. *scientific* scientists marginalised.
Human conflicts whether in schoolyard or international always resolve themselves into two sides. Wherever there are combatants bystanders are bound to decide whose side they’re on. As in World War when US and Soviets fought on same side then immediately turned on each other. No different in principle to *any* squabble which escalates such that others who had nothing to do with the original dispute eventually have to choose sides.
Today the two sides are globalists / ‘elite’ v nationalists / ‘populists’. No doubt there are any number of internal rivalries on both sides. But the oppositional alignment is clear enough, the same interests converging around CV-19 as other globalist causes inimical to the cultural identity and loyalties of ordinary Europeans / West / Christendom.
Last year 280,000 non-Europeans arrived on these shores, the highest number in a single year ever. Even without such an influx the ethnic minority status of the indigenous is guaranteed on current birth rates yet is unmentionable in the public domain.
Any European with a public profile daring to suggest that native Europeans should have anymore right of abode than new arrivals risks being condemned as ‘racist’ by Daily Mail / BBC and excluded from public life altogether. Meanwhile anti-European race activists are given a platform throughout the media, their openly antagonistic identities celebrated.
Facts and insights on Chinese connection here:
https://www.civitas.org.uk/content/files/2449-A-Year-of-the-Bat-ppi-72-WEB.pdf
@Pcar
Only thing I’d add is that a fearful atomised populace with no loyalties greater than to Netflix or Instagram likes is as amenable to professional public sector mandarin classes / ‘deep state’ as to purveyors of bread and circuses / global capital. Hence plutocrat media in political lockstep with officialdom. The billionaire Trump who dares to defy the plutocrat / ‘deep state’ coalition in some degree an exception proving the rule. The one and only politician, at least in the Anglosphere, who recognises the media as political agents in their own right.
Essential reading here on China – really quite shocking:
https://www.civitas.org.uk/content/files/2449-A-Year-of-the-Bat-ppi-72-WEB.pdf
Sean: ” The billionaire Trump who dares to defy the plutocrat”
My irony meter just broke.
Pcar,
“Think about that: Government wanted public in fear and panic”
This is it. In order to justify and reinforce this useless government’s decisions, the Coronavirus Act was introduced. Amongst other items, it contained this nonsense:
.https://www.gponline.com/death-certification-during-coronavirus-outbreak/article/1679509
I believe Johnson’s “death bed experience” was also inflated to reinforce that fear and panic.
Simon: “If it has changed, towards less aggressive values, then I suggest we all thank the deity of our choice because there’s no reason to think we should be so relatively lucky (that’s compared to the repeated LDs which would otherwise be needed).”
Even if Ferguson’s model was right about the need for repeated lockdowns, the key question is whether the country could afford to do so. The current lockdown feels like a pyrrhic victory in the sense that we might not be able to afford another such victory. Afford it economically, socially and mentally.
@Sean Lydon
Agree. Sick of TV News full of someone’s sob story, I am not interest and don’t care. Grief is personal end off.
Banning motorcycles – they’d love to using safety as excuse. EU tried power/speed ceilings, bikers overcame them and derestricted
Gov’t etc don’t like bikers as we’re freedom lovers and treat laws as a nuisance. It’s why bikers in USA support Trump, and in UK last year, ignored by msm, Rolling Thunder in support of Military
Folks, remember we’re not immortal, we all die; in UK ~1,650 die every day
@John Wilkinson
+1 Reports at time said he walked into hospital ICU
@Dene: “My irony meter just broke.”
Lol yeah Dene, as ever paradoxes abound. Trump must be a ‘plutocrat’ himself insofar as the presidential system is plutocratic requiring enormous wealth even to be a contender, let alone a winner. It was only as a billionaire that Trump wasn’t beholden to vested interests and able to side with Main Street against Wall Street or economic nationalism against global capital or civil society against media corporations / officialdom / ‘deep state’ inasmuch as he has, if he has.
The data suggests he confronted media / ‘deep state’ vested interests politically, gaining populist / nationalist, forfeiting liberal ‘elite’ support for that reason. Ascetic Jeremy Corbyn is reversely symmetrical, supporting capitalist / plutocrat sponsored free movement / open borders while identifying as ‘socialist’, which he previously opposed on socialist grounds as a Leave supporter in the first referendum, before switching to Remain for the second referendum still identifying as ‘socialist’ / ‘anti-capitalist’, forfeiting the ‘populist’ vote, gaining the ‘elite’.
@Pcar
*Sick of TV News full of someone’s sob story,*
Yeah I can’t bear to watch the news – all sanctimony and infantilising Marxist propaganda. Call me old fashioned but it sickens me to see people wearing helmets to ride pushbikes – how did that happen? Now grown men wearing masks as well! But no society ever survived where women got upper hand in public life… In Africa you’d see 3 or 4 on a moped not including a goat and a couple of hens, and maybe a sofa or two.
Nice video – good to see! Some tasty machines on display as well. Anything nationalist which can’t be slandered is ignored by the media, that’s a given.
Comments are closed.