New Covid-19 graphs from Christopher Bowyer. ONS data here. NHS England data here. (The ONS data is up to the end of week 35, 28 August. The NHS data is generally more recent, see each graph for the date.)
All graphs can be clicked to enlarge.
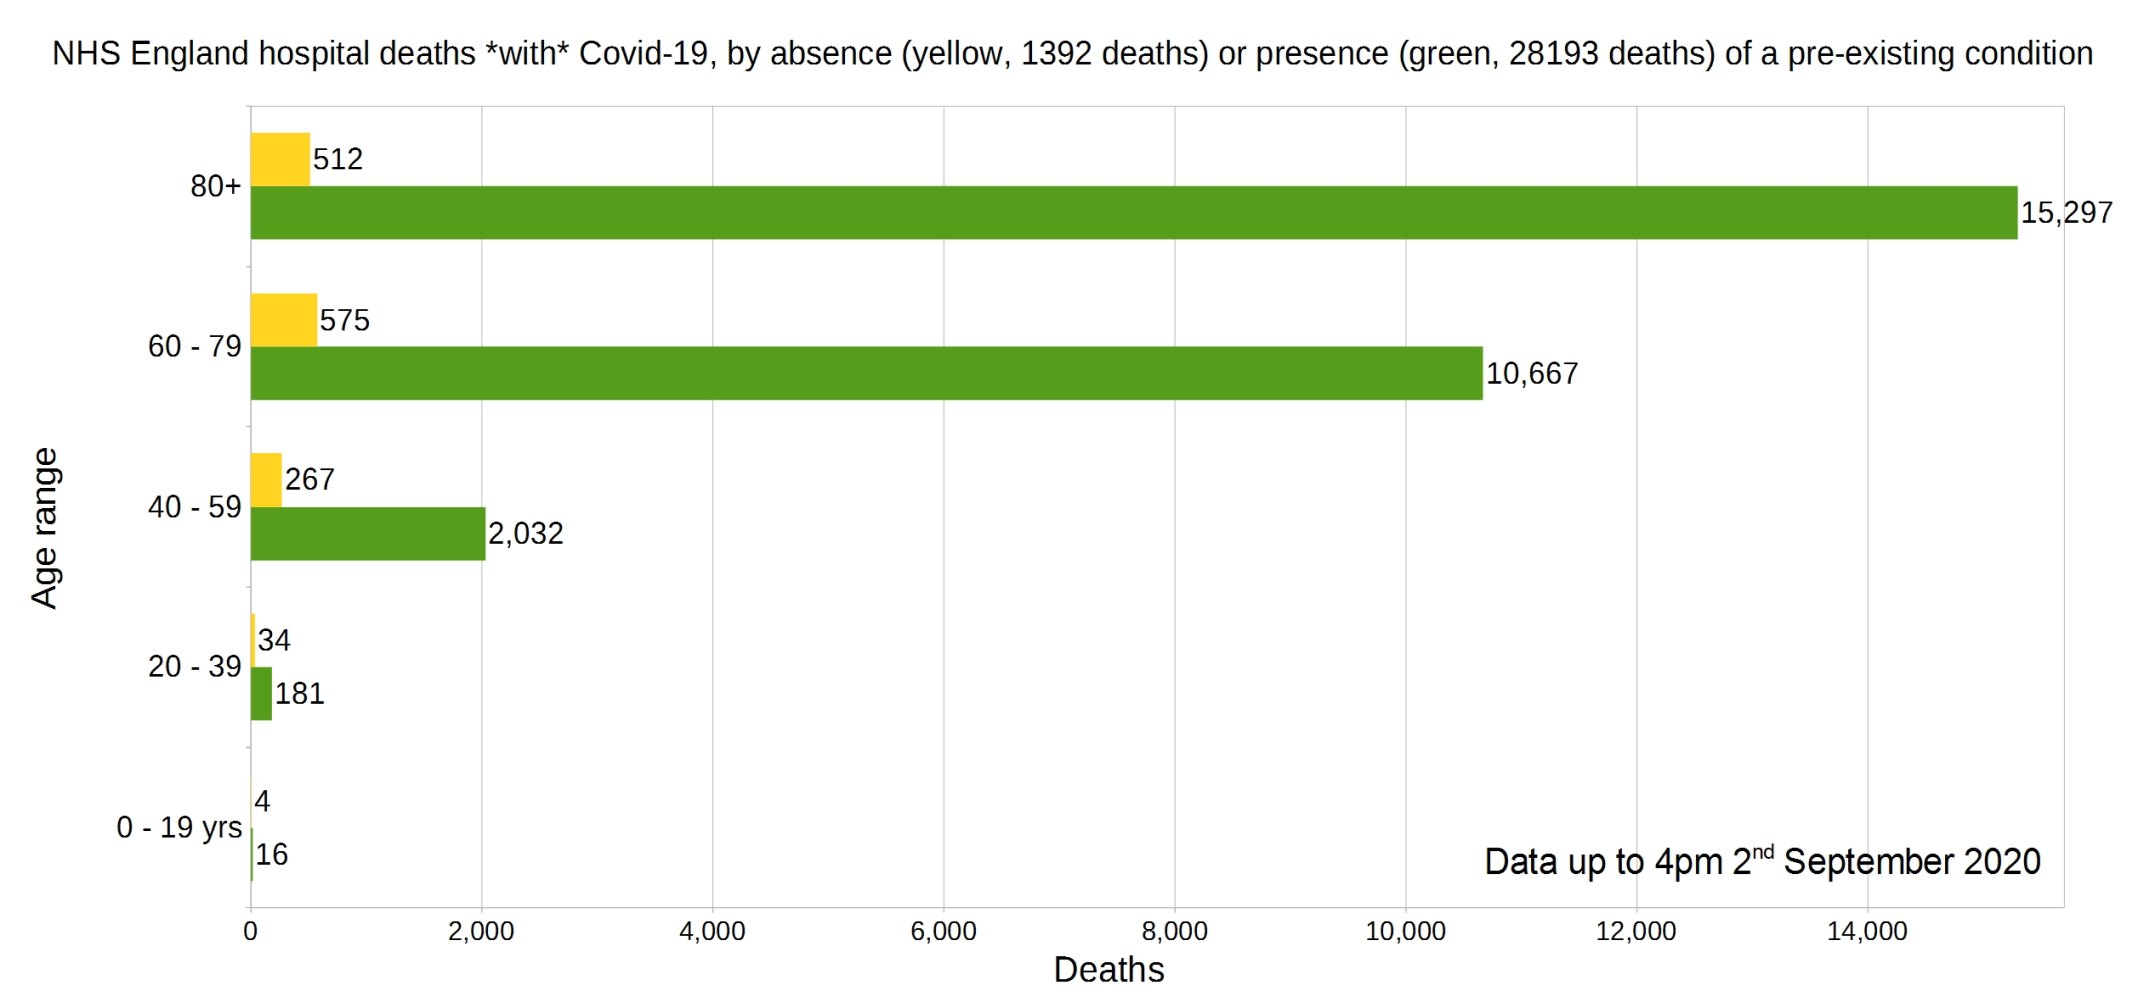
England deaths with Covid-19 by absence (yellow) or presence (green) of a pre-existing condition. Data from NHS England.
Percentage of deaths with Covid-19 by pre-existing condition. (95% have one or more P.E.C.) NHS England data.
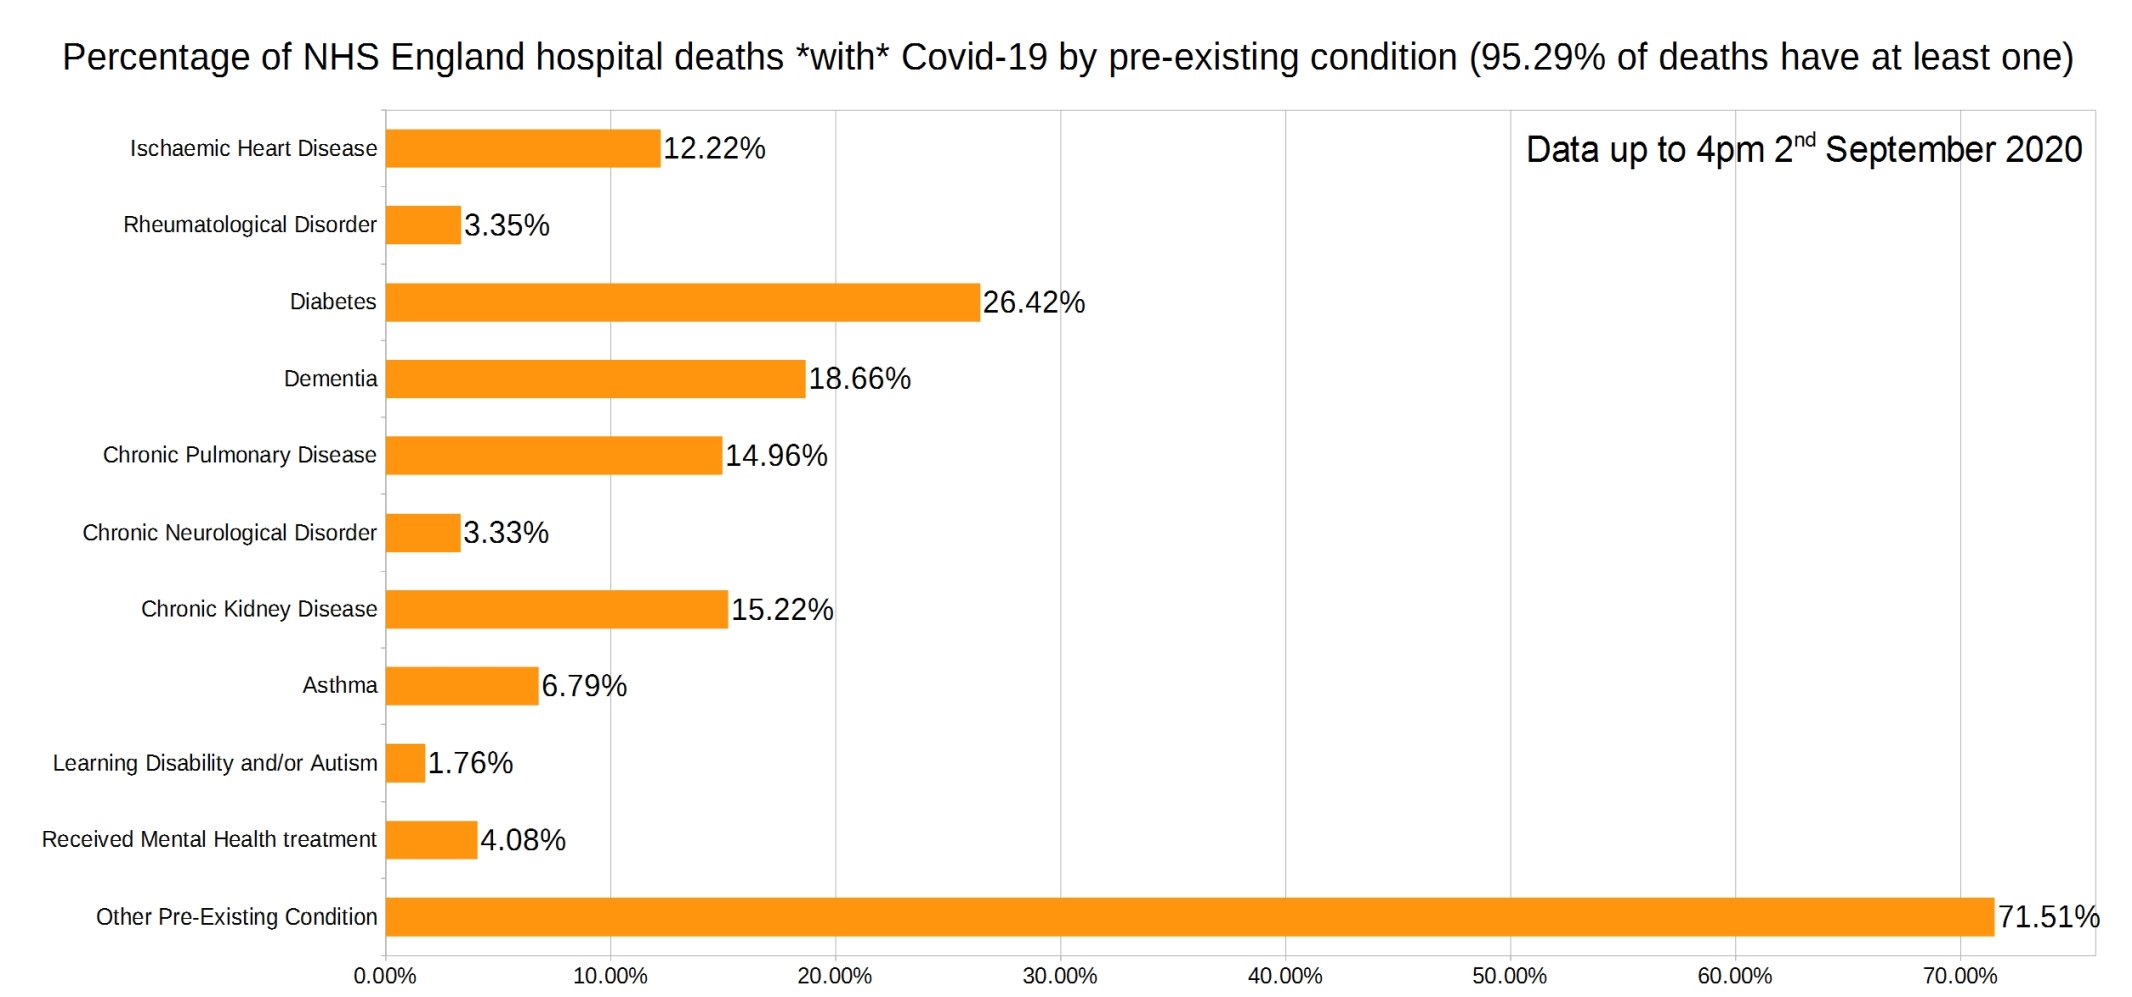
Note that the most common pre-existing conditions are diabetes, followed by dementia, chronic pulmonary disease, and chronic kidney disease.
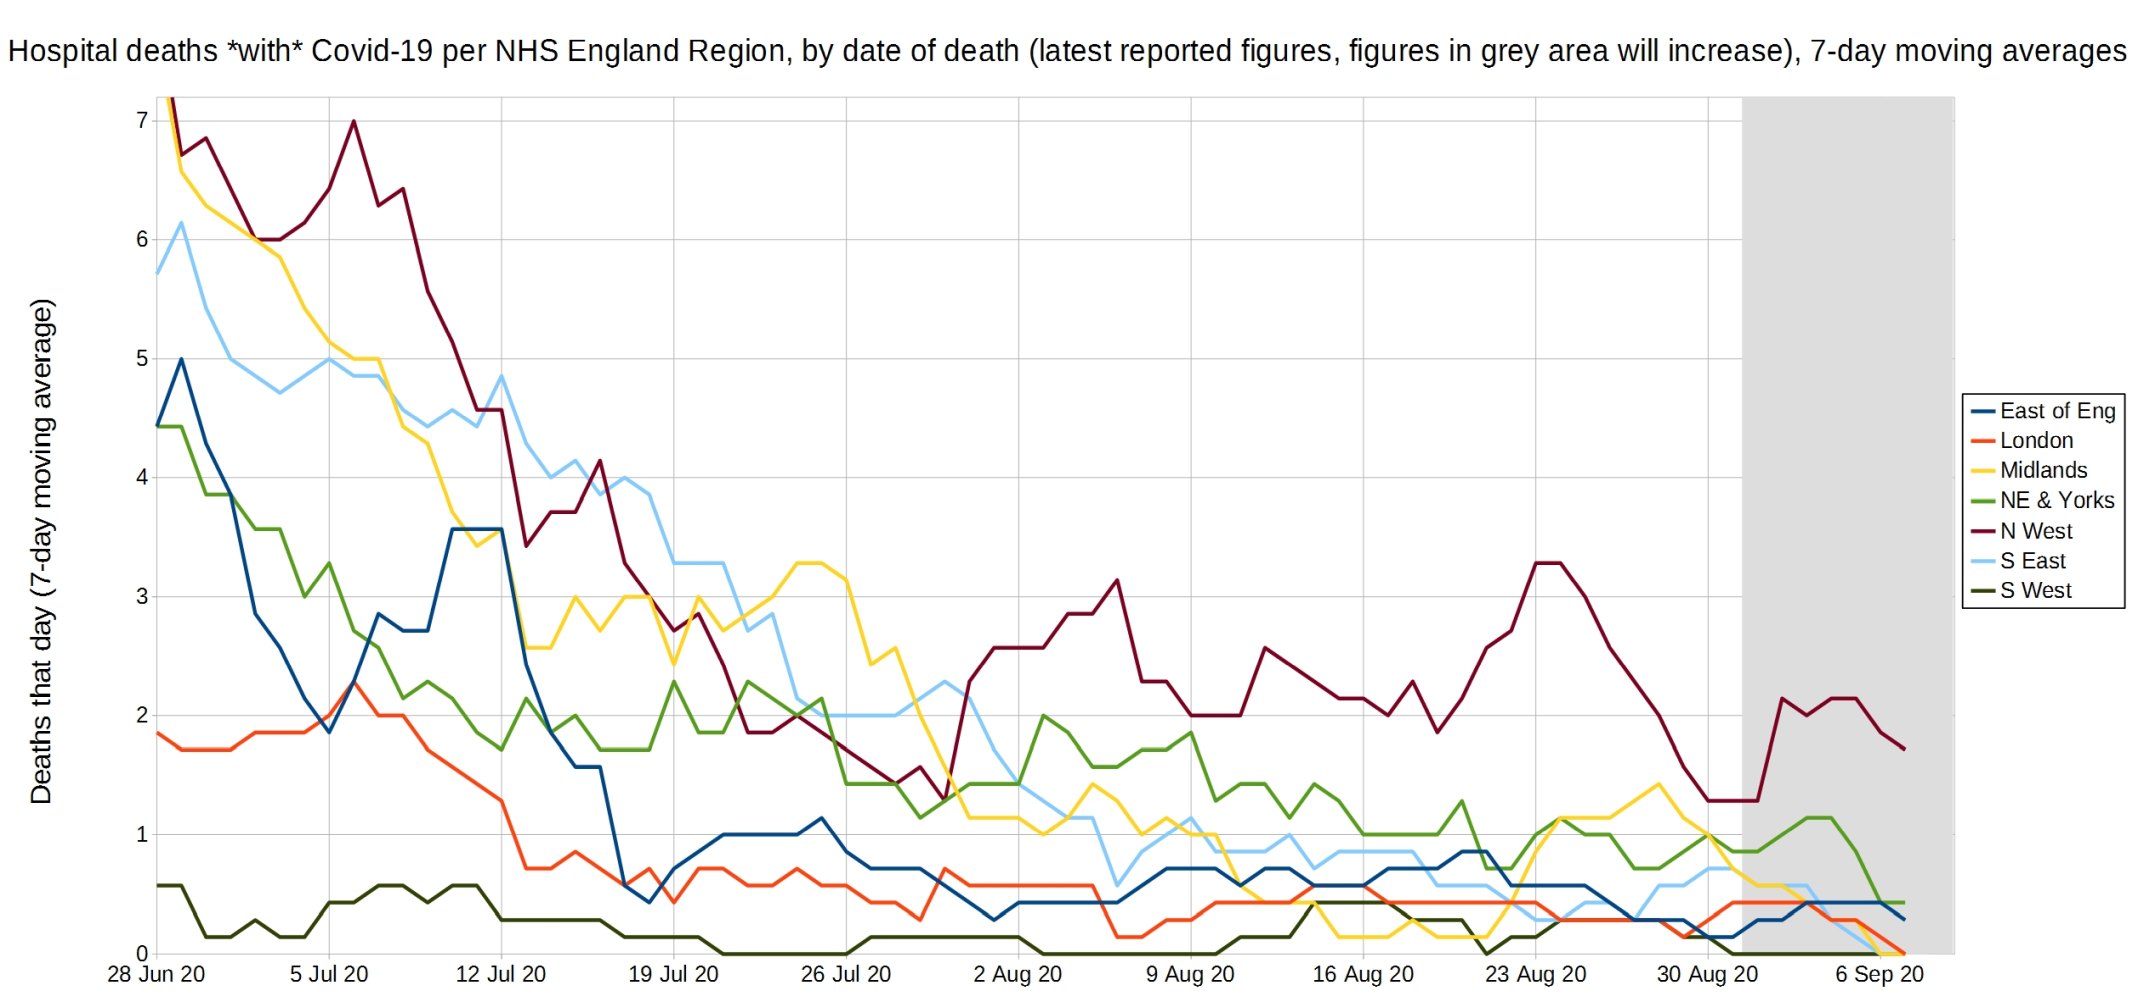
Trendlines (7-day average) for Covid-19 deaths by England NHS region, by date of death. (Note that the numbers in the grey area may increase over the next few days.) NHS England data.
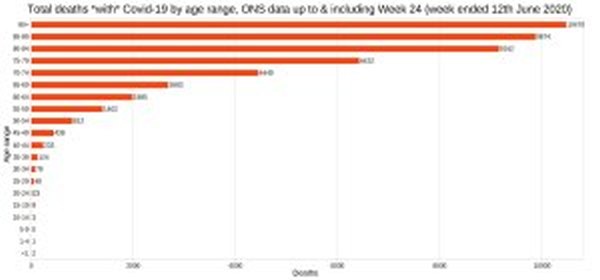
England and Wales total deaths with Covid-19, by detailed age range. ONS data.

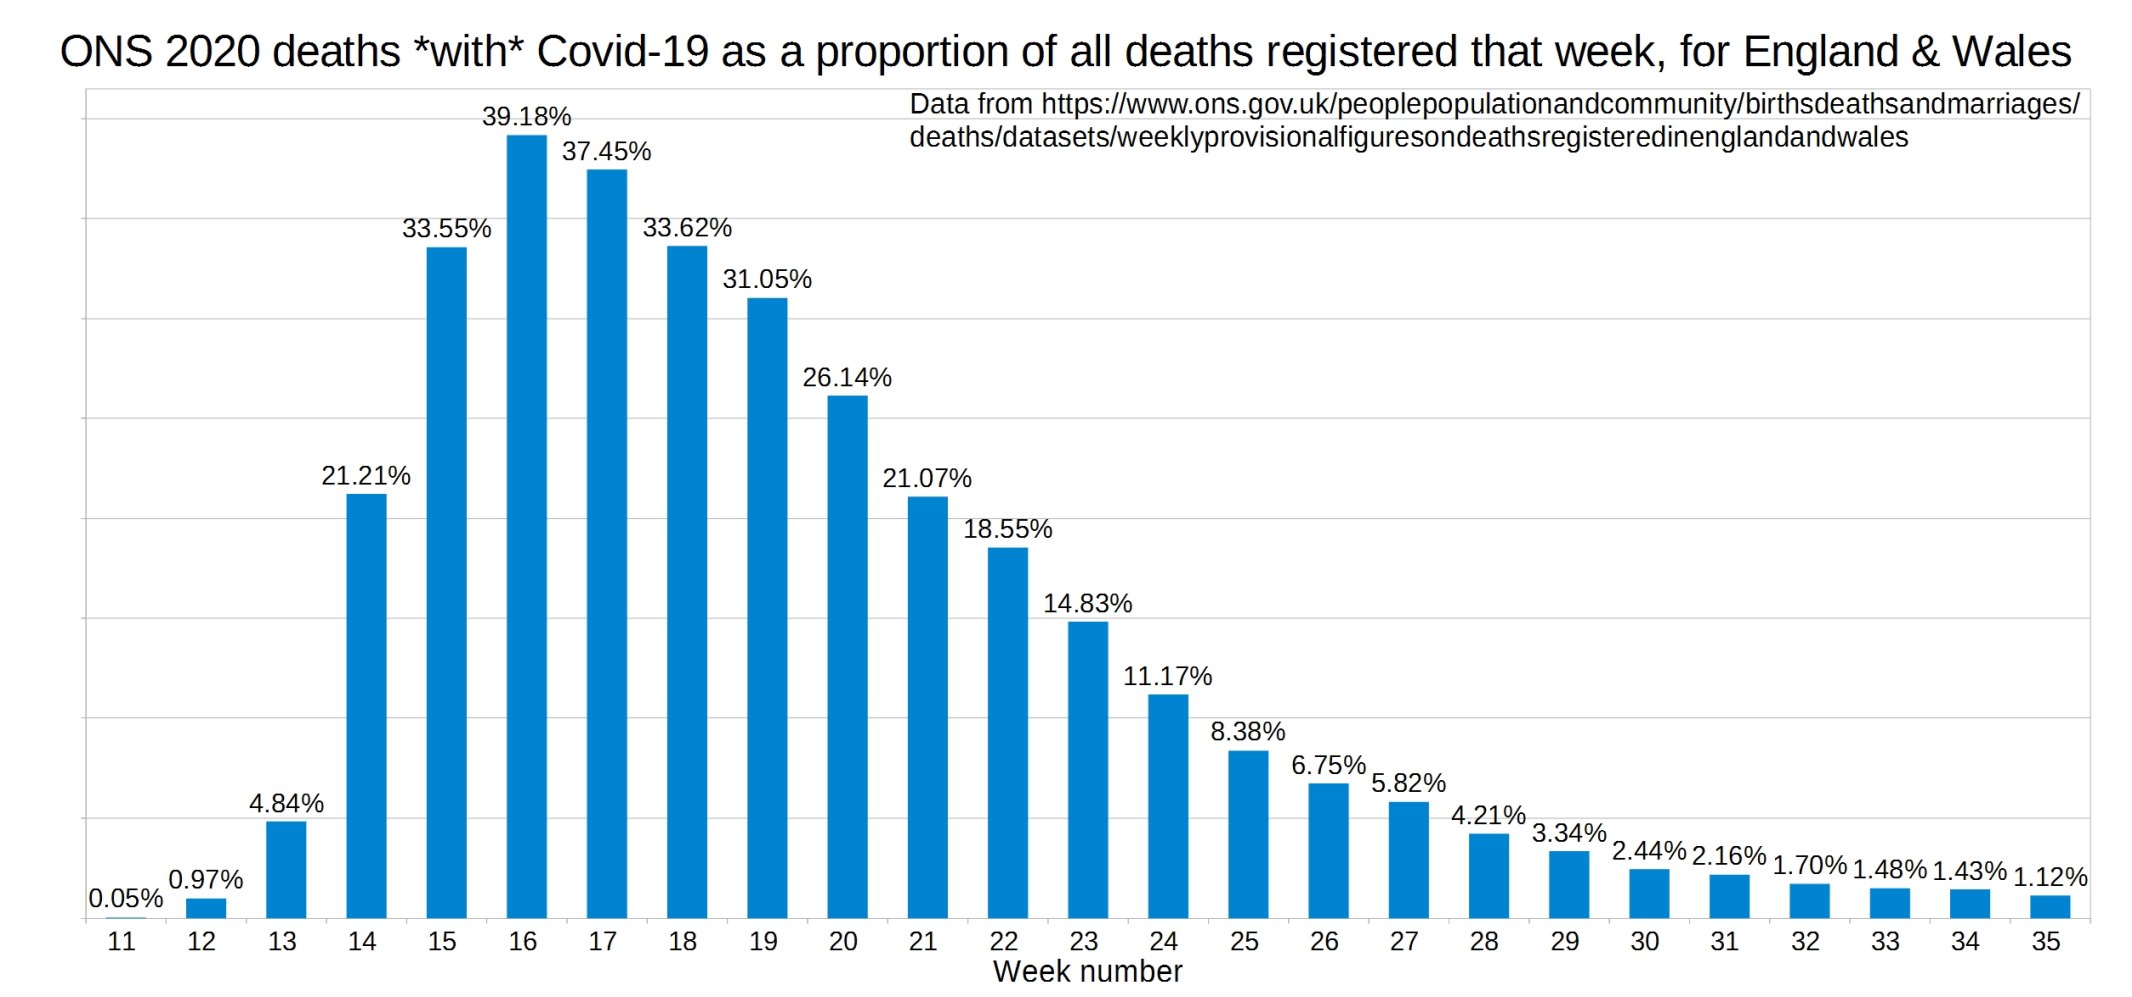
ONS England and Wales Covid-19 deaths as a proportion of all deaths registered that week.
ONS England and Wales weekly all-cause deaths compared with the five-year average.
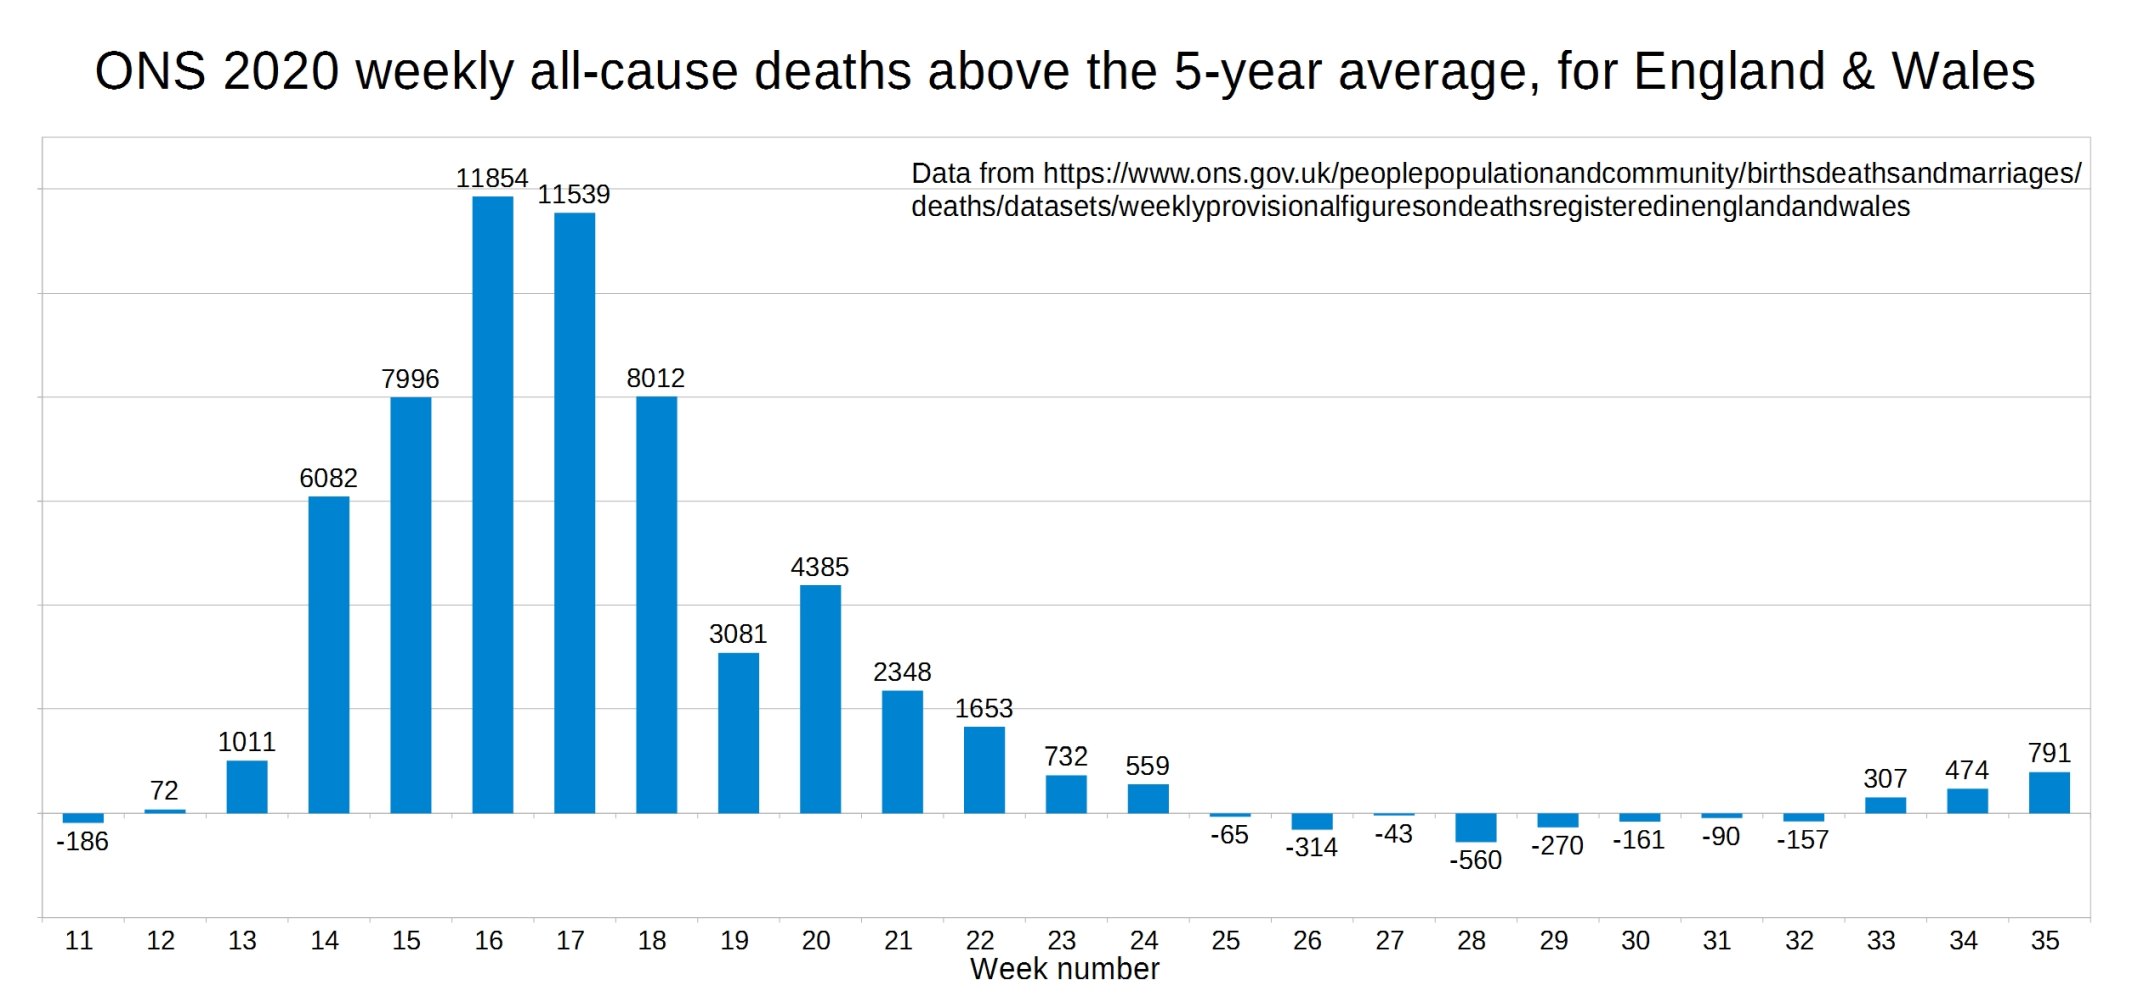
Note that all-cause deaths are, for the third week in a row, significantly above the five-year average for those weeks, despite Covid-19 deaths now being negligible. Heatwave deaths can’t be the explanation of all these.
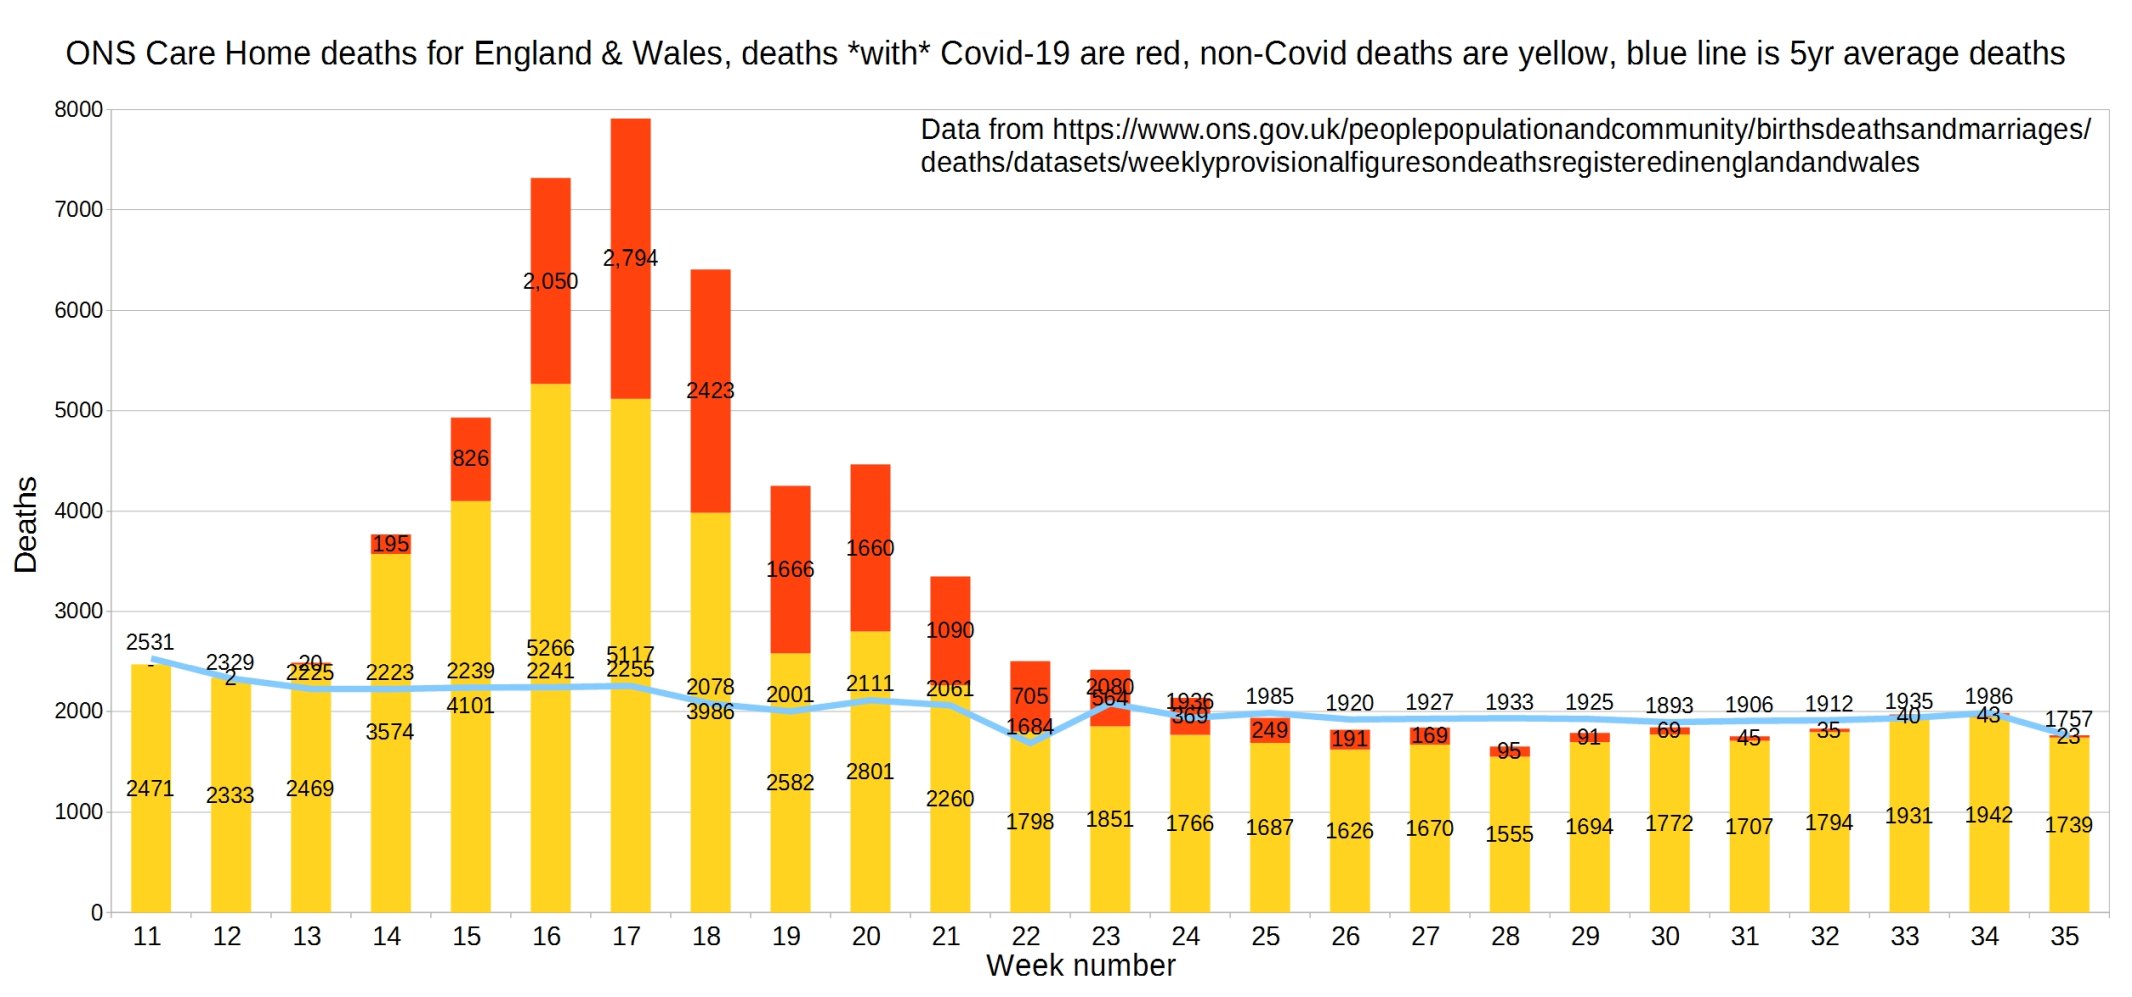
England and Wales weekly Covid and non-Covid care home deaths. ONS data.
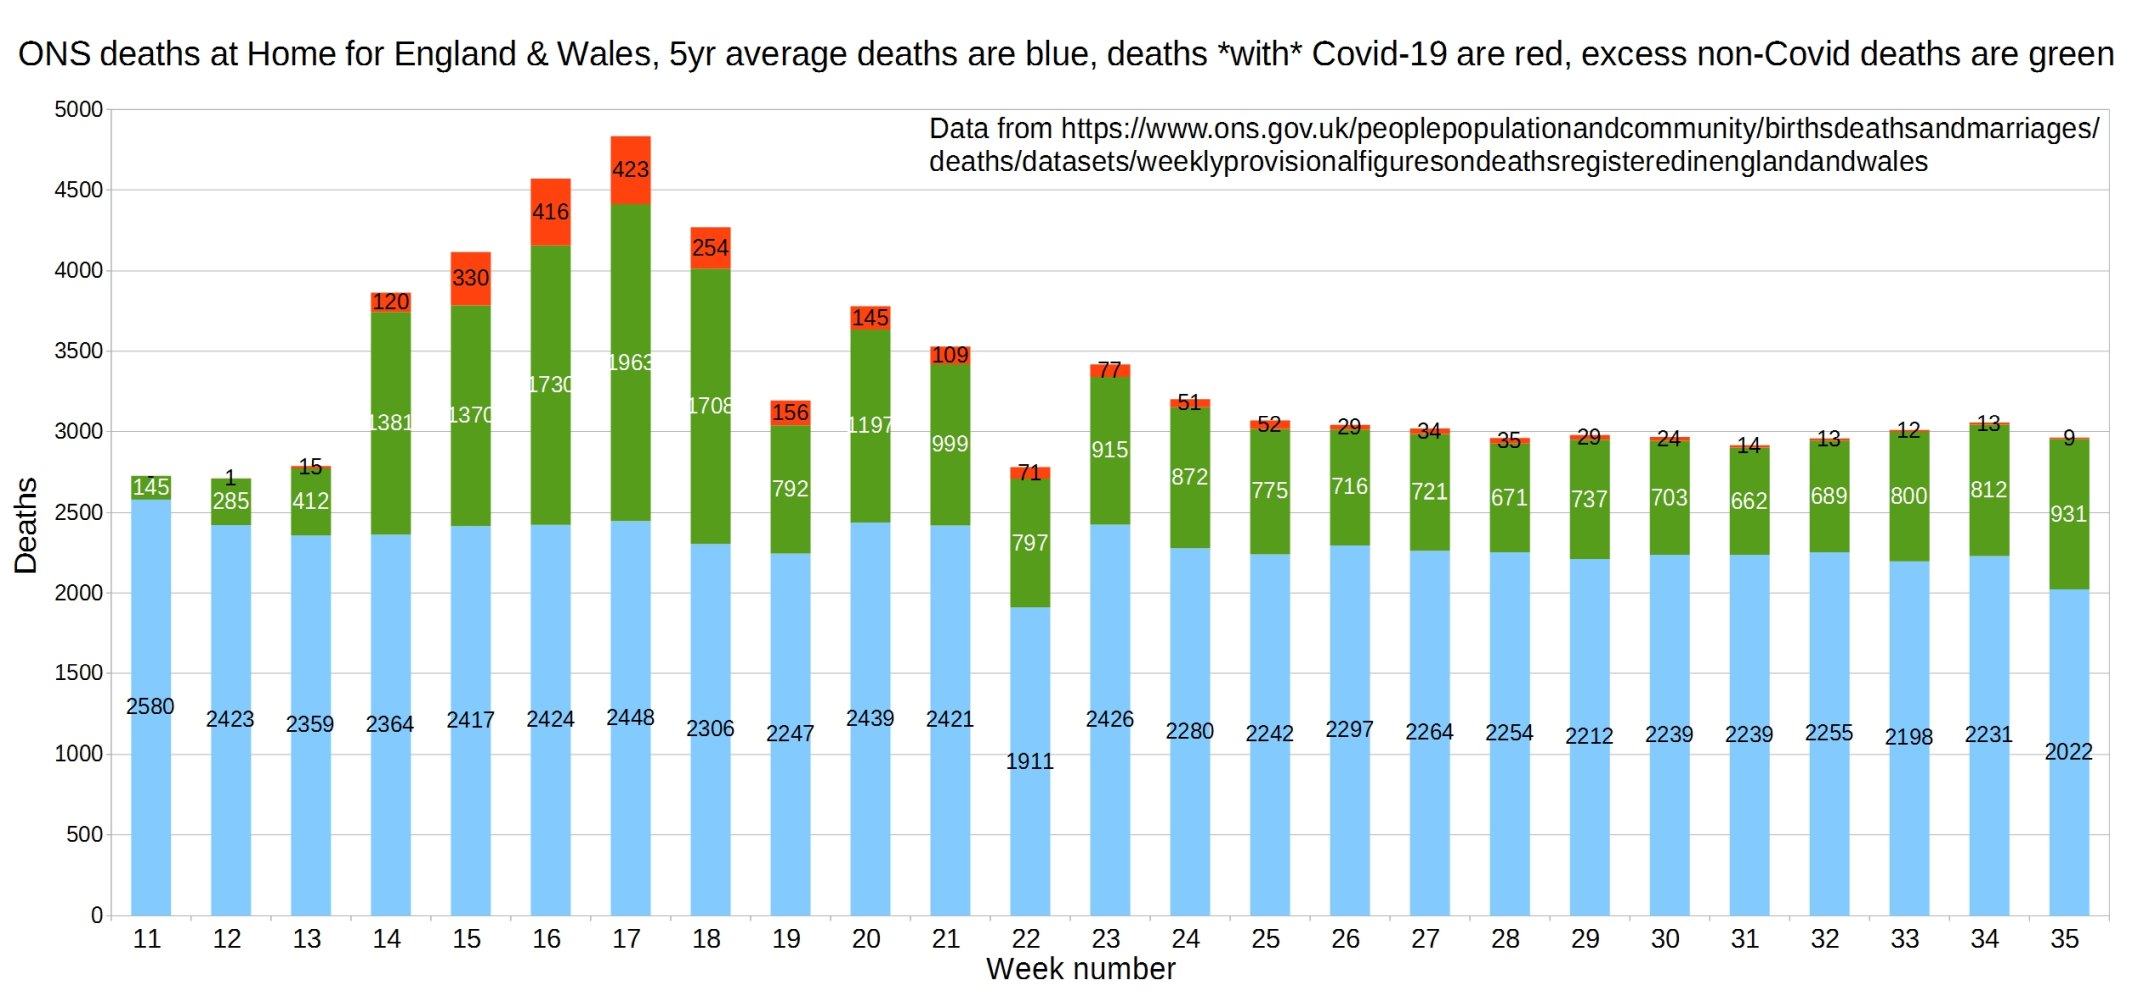
England and Wales weekly Covid and non-Covid deaths at home. ONS data.
Hospital deaths for England and Wales. ONS data.
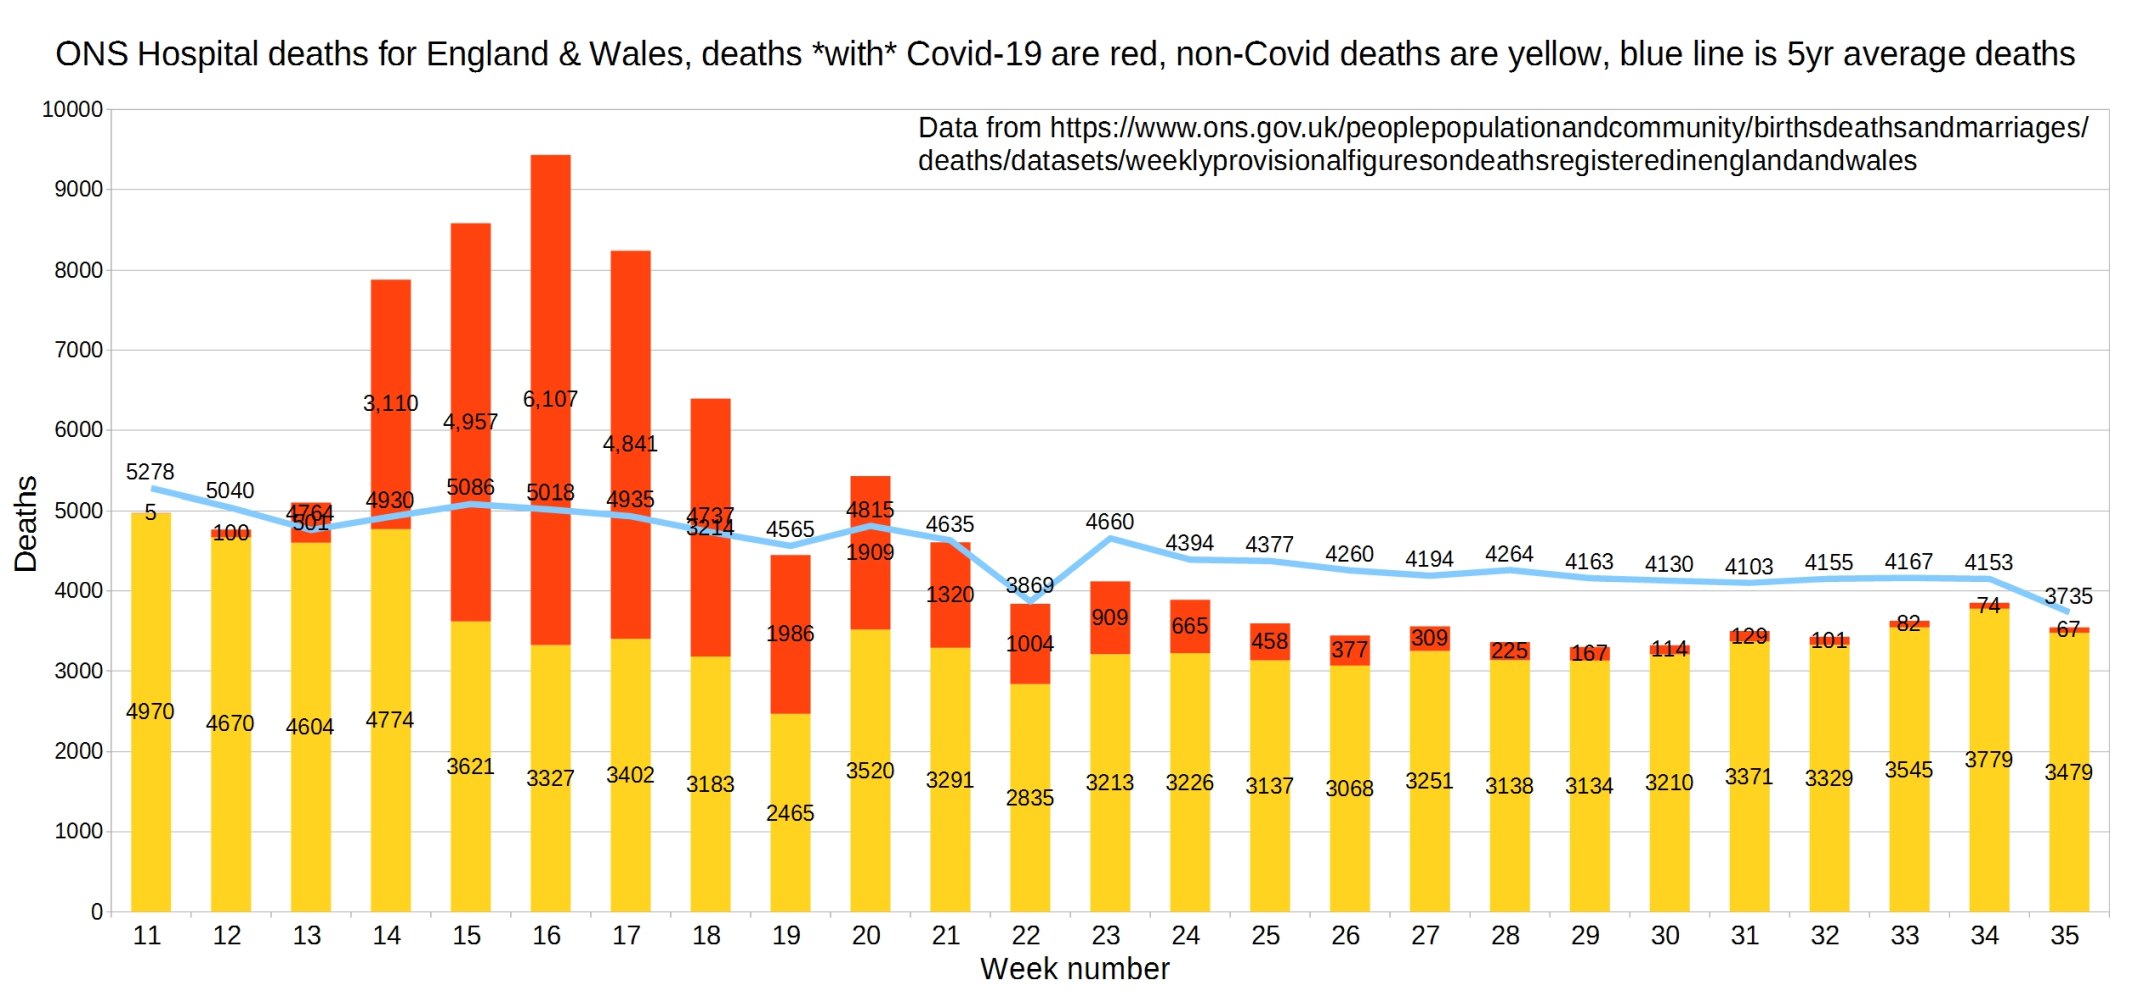
Concerning the last three graphs, Christopher writes:
I discovered that the ONS 5yr average deaths by place stats I had found are not the same as they’re using for their bulletins https://www.ons.gov.uk/peoplepopulationandcommunity/birthsdeathsandmarriages/deaths/bulletins/deathsregisteredweeklyinenglandandwalesprovisional/latest#deaths-registered-by-place-of-occurrence so I have downloaded the data from the bulletin instead. This will change the deaths at home/hospital/care home graphs a bit from previous weeks, but will lead to improved accuracy.
NHS England hospital Covid-19 deaths each day, latest reported figures, with 7-day moving average trendline.

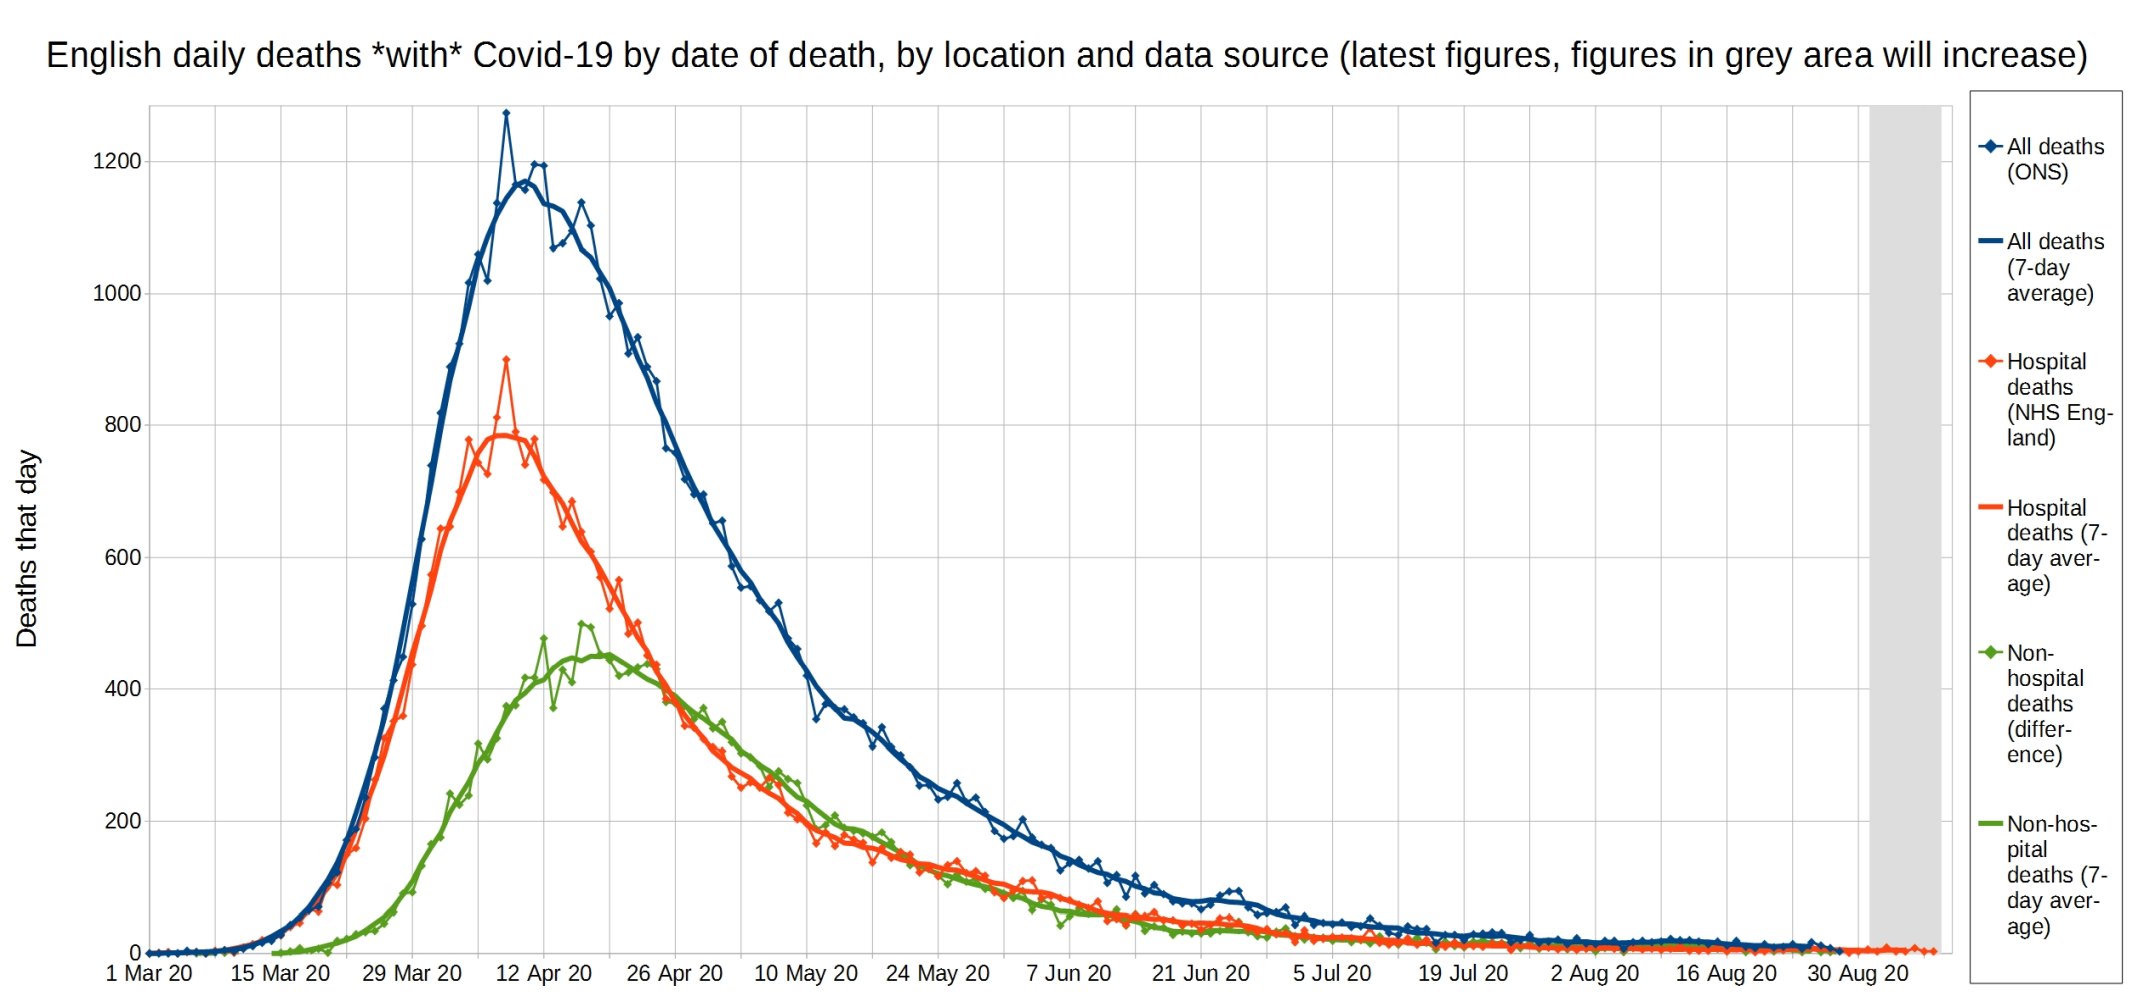
All Covid, hospital Covid, and non-hospital Covid deaths in England each day, with 7-day moving average trendlines.
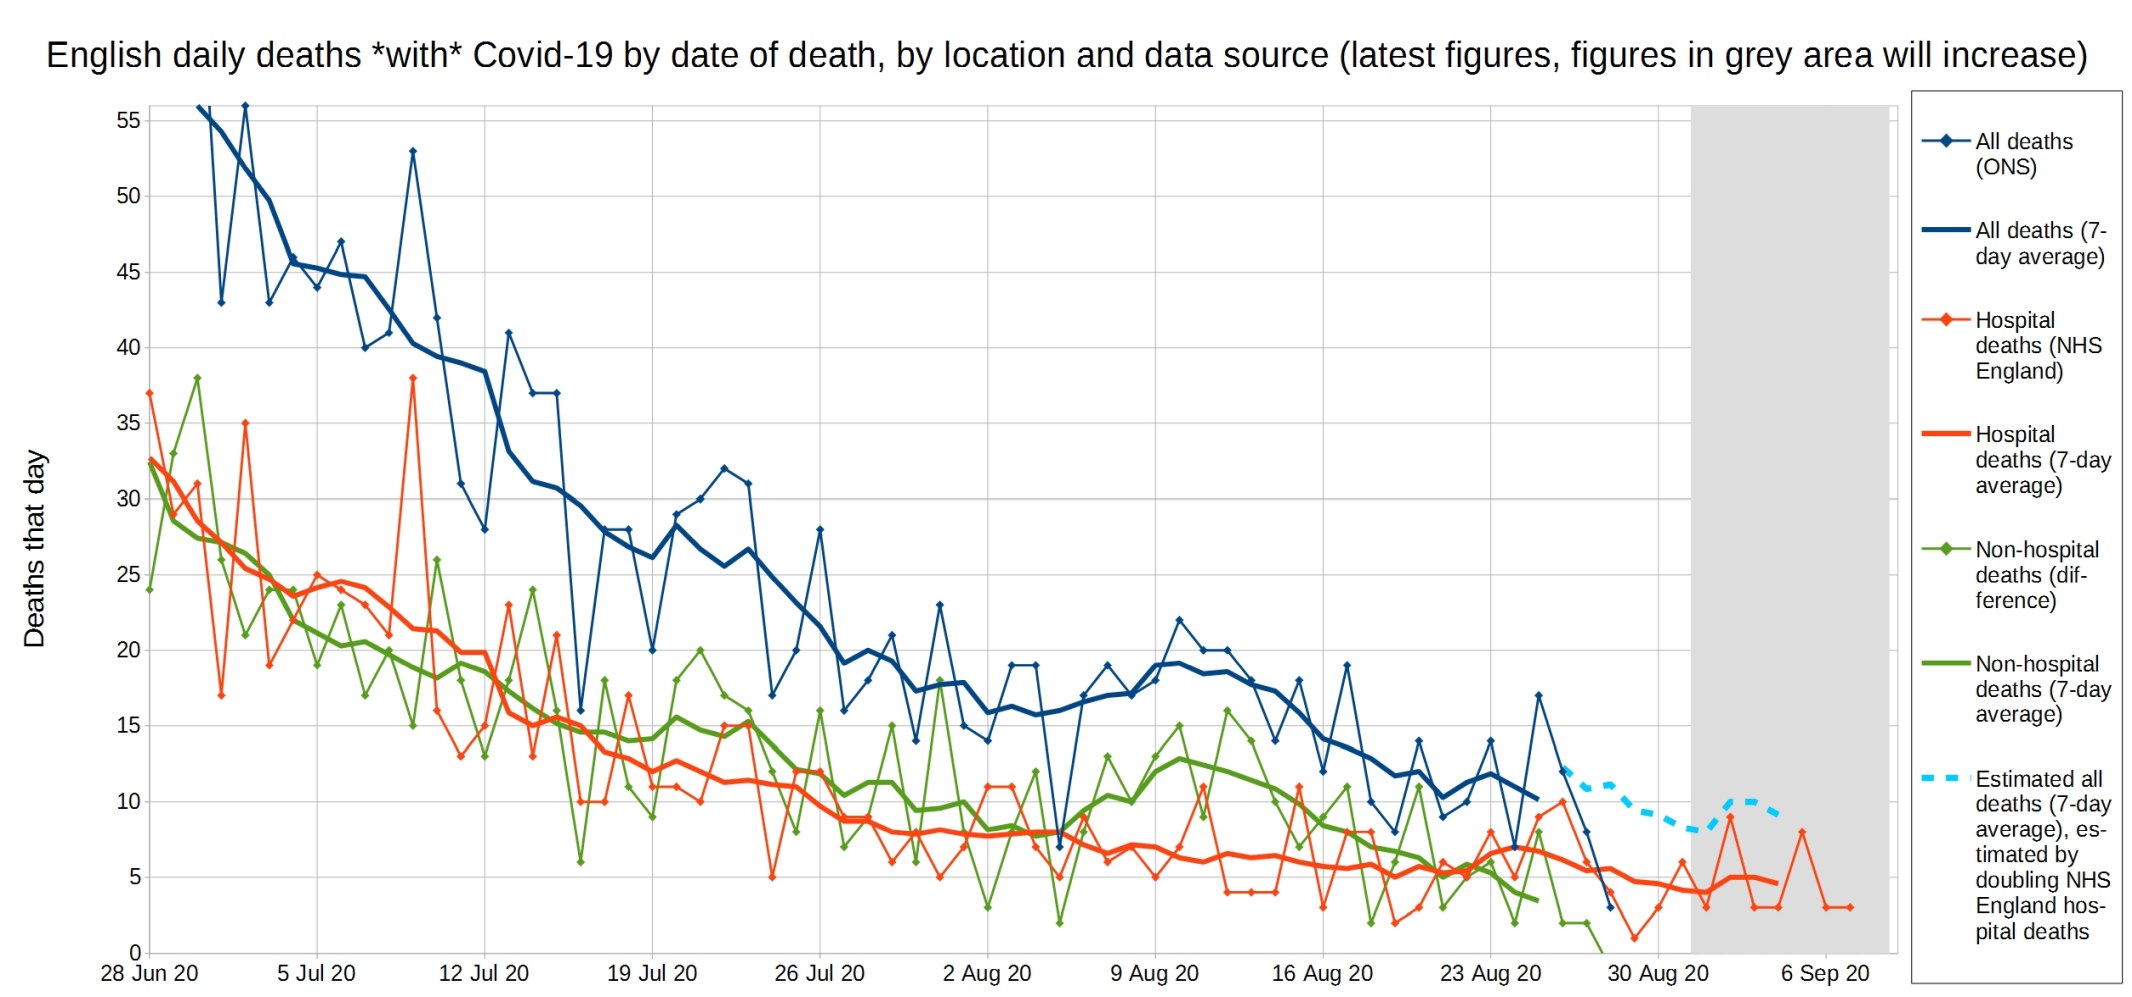
A close-up of this graph, looking at recent weeks.
Update: Please support this website by donating via KoFi, subscribing via SubscribeStar or Patreon, or buying my book (see right-hand sidebar for links). Independent media like Hector Drummond Magazine, and my constantly updated Twitter and Parler accounts, cannot survive without your support.
6 thoughts on “Week 35 graphs from Christopher Bowyer”
Christopher, Thank you
Closed NHS and Lockdown deaths. We’ll soon be at more deaths due to this Gov’t idiocy than ‘with’ Covid-19, yet Gov’t keeps digging
Apposite:
I went back and looked at the version of the first graph from Week 25, and subtracted the data from the current version to get an incremental picture. The age profile of deaths in the past 10 weeks is essentially identical to the first 25 weeks. However, the proportion of deaths solely due to the virus with no co-morbidities has fallen from 4.74% to 3.28% – just 69% of the previous level . Treatment appears to be improving, particularly for those 70+. Co-morbidity is even more the main risk.
Great graphs, Mr. Bowyer. Thank you!
The graph that screams for action is the one showing that the proportion of deaths listed as “with” Covid has dropped over the last 5 months from 39% to about 1% . Problem over! When 99% of people who die each week are dying from causes other than Covid, it is time to move on — do something to help the 99%.
This is so obvious that one wonders what is going through the minds of our “Lock the Peons Down” Betters?
I am a relative newcomer to this site and like the way the data is set out simply, it’s and easy to read and understand. Thank you and well done. One of my go to sources of information. Why isn’t this stuff published in MSM?
@Gavin
Yes, ONS finally making it clearer
Flu and Pneumonia Have Killed More People Than Covid Since June
https://lockdownsceptics.org/2020/09/16/latest-news-136/
It becomes worse
All the positive tests could easily be False Positives
@Jack
MSM signed up to Gov’t Project Fear C-19 in mid March – Delingpole at Breitbart reported it. Spectator, DM and Telegraph opinion columnists mostly like here. BBC, C4 etc brand us “Deniers, Conspiracy Theorists” – see Mr Church’s Witch/Heretic article
Result:
Excellent – Lord Sugar lays into msm & Gov’t big tme
Real cases “With” of <150 pd in England (60 million people) – nothing. We do take it Seriously, and if you did you would be attacking Gov't instead of easy consensus option of stoking bed-wetting
Important
I’m all in favour of self/parental administration of Flu vaccine – done it since 1989. Health “profession” against to preserve their image, jobs and ‘magic’
Yes, yes, yes
Comments are closed.