So our indefatigable graph-makers David Clark (who does this sort of thing for a living) and Robert Watson (retired Professor) have been hard at work making some updated graphs based on the latest ONS figures, released 31 March. The figures go up March 20 (the end of what their system calls week 12).
When I put up the last set of graphs on Twitter various people said, “Oh, but you have have to wait a few weeks for the bad stuff to show”. Well, I put these new graphs up on Twitter earlier and people were quick to say, ‘Oh, but you to wait a few more weeks for the bad stuff to show’.
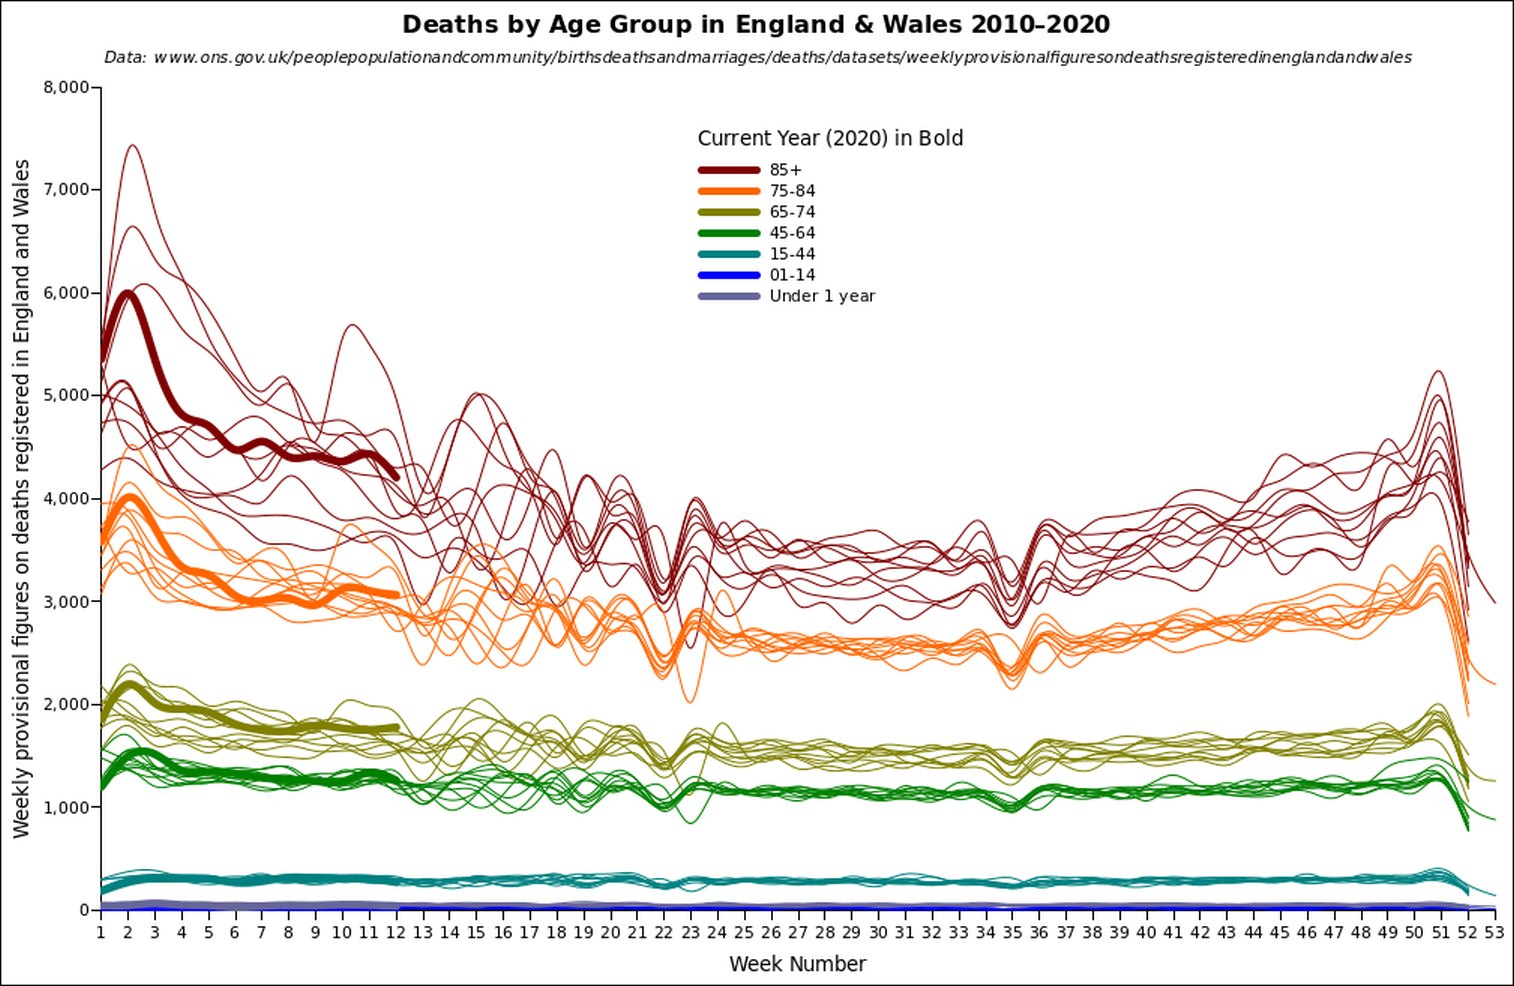
Here’s David’s graphs first. Firstly, here’s a graph of deaths in England and Wales for people over 85, for 2010-2020. (Click to enlarge.)

Here’s a graph of deaths in England and Wales for people aged between 75 and 84, for 2010-2020. (Click to enlarge.)

And now a graph of deaths in England and Wales for people aged between 65 and 74, for 2010-2020. (Click to enlarge.)

This mass slaughterer of old people is clearly very good at hiding out until the last possible moment, isn’t it?
David says, “The vertical scale is the same for each [graph] so it can be seen how deaths age 85+ are much higher relative to those for the age 75–84, and 65–74. Note also how the deaths of the very old are not only very seasonal but vary significantly year to year according to the severity of the winter season.”
Next up, we have a graph of deaths in England and Wales, stratified by seven age ranges, for 2010-2020. The thick line is the current year. (Click to enlarge.)
Finally, all the England and Wales deaths (not stratified by age) for 2015-2020, with 2010-2014 in there as a line as well for comparison purposes. (Click to enlarge.)
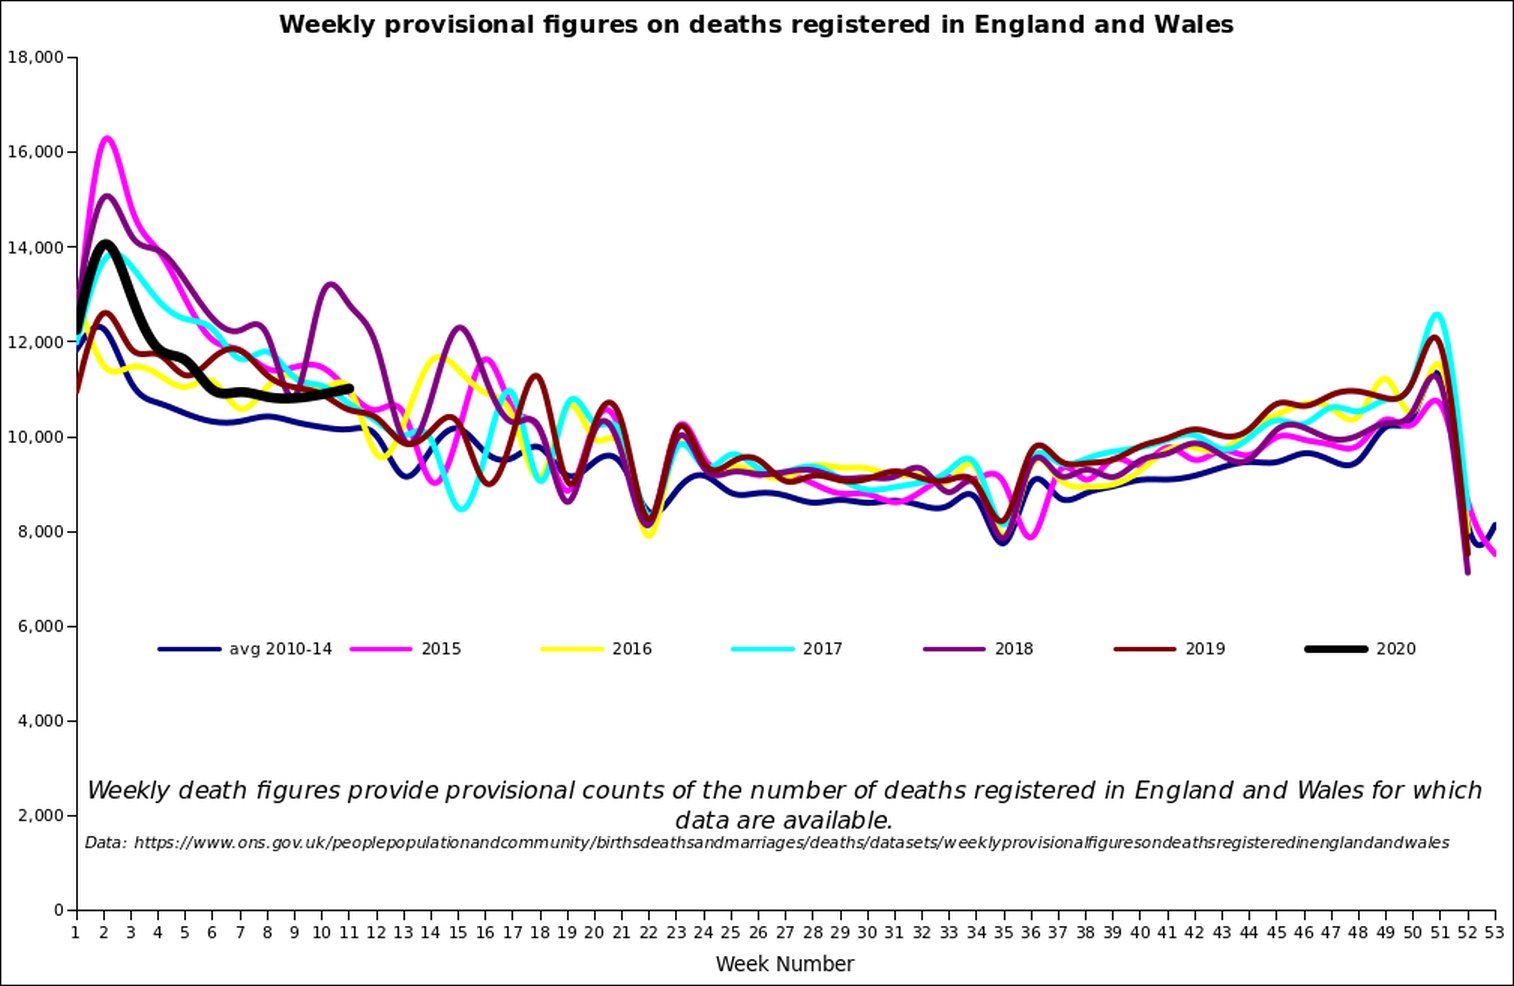
So there is no sign whatsoever of a killer in that data. It’s a perfectly normal year.
But maybe you think we can see it in the respiratory deaths. Especially now that ONS have taken the extremely dubious and desperate step of recording every death of someone who died with Covid-19 as a Covid-19 death, even if there’s no reason to think they died of Covid-19. Covid-19 is a ‘notifiable’ disease (like anthrax), which means that for anyone who died with Covid-19 — even just suspected Covid-19 — that has to be noted on the death certificate. And the ONS has now decided to record any such death as a Covid-19 death. Yes, we’ve become like Italy, with dodgy stats.
(More info at this ONS blog post.)
There is one possible kind-of-justification for this, and that is that we already suspect that a lot of deaths that were caused at the last moment by flu are not recorded as flu, because if someone, say, has very bad cancer, and they die with the flu, that gets recorded as a cancer death, even though the flu may have been the final cause of death.
This is not, however, something we worry about too much because in a way it would be misleading to record that person’s death as being from flu, seeing as they were probably going to die anyway. We are more interested in looking at how many deaths are caused by underlying conditions like cancer, rather than the flu that was the straw that broke the camel’s back. And also because flu is something that no-one is very worried about. So facts like these have led some people to claim that that flu deaths are, in a way, under-reported.
But this means that we have a double standard here, because when people compare flu deaths to Covid-19 deaths they won’t realise that there were many more deaths that would have been attributed to flu if we had adopted the same standards as we are now doing with Covid-19.
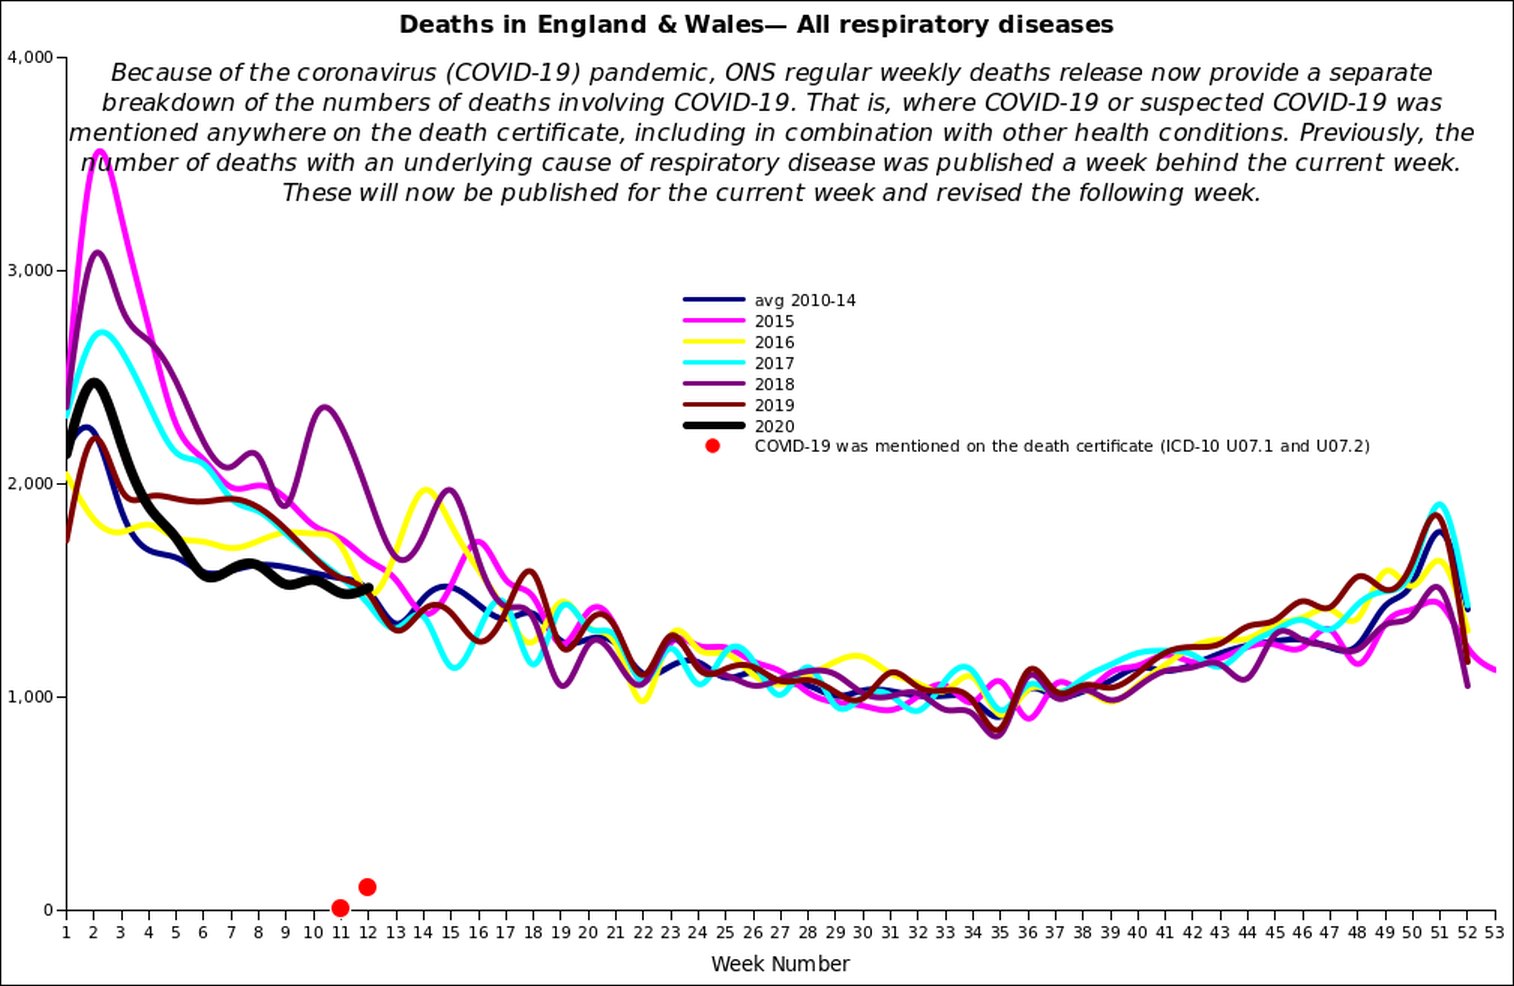
Despite those double standards, though, despite the ONS adopting a method that will artificially increase the number of Covid-19 deaths, and thus the number of respiratory deaths, there is still nothing in the latest respiratory death numbers to indicate the existence of any lurking viral T-Rex.
Look now at David’s graph for respiratory deaths in England and Wales for 2015-2020, with the 2010-2014 average in there as well for comparison purposes, and some red dots to indicate the period when the new C-19 death certificate practices were in operation. It’s still nada, zip, zilch.
If this monster is about to explode he’s going to do so out of nowhere.
For further perspective, I present Robert Watson’s two updated respiratory graphs. They use the same data as David’s respiratory graph, they just presents it differently. Both are extremely useful ways of taking in the data quickly.
Firstly, we have Robert’s updated graph, with the latest statistics for 2020, graphing respiratory deaths by week in England and Wales vs the prior five-year average. (Click to enlarge. Note that orange line is five-year average, blue line is 2020).
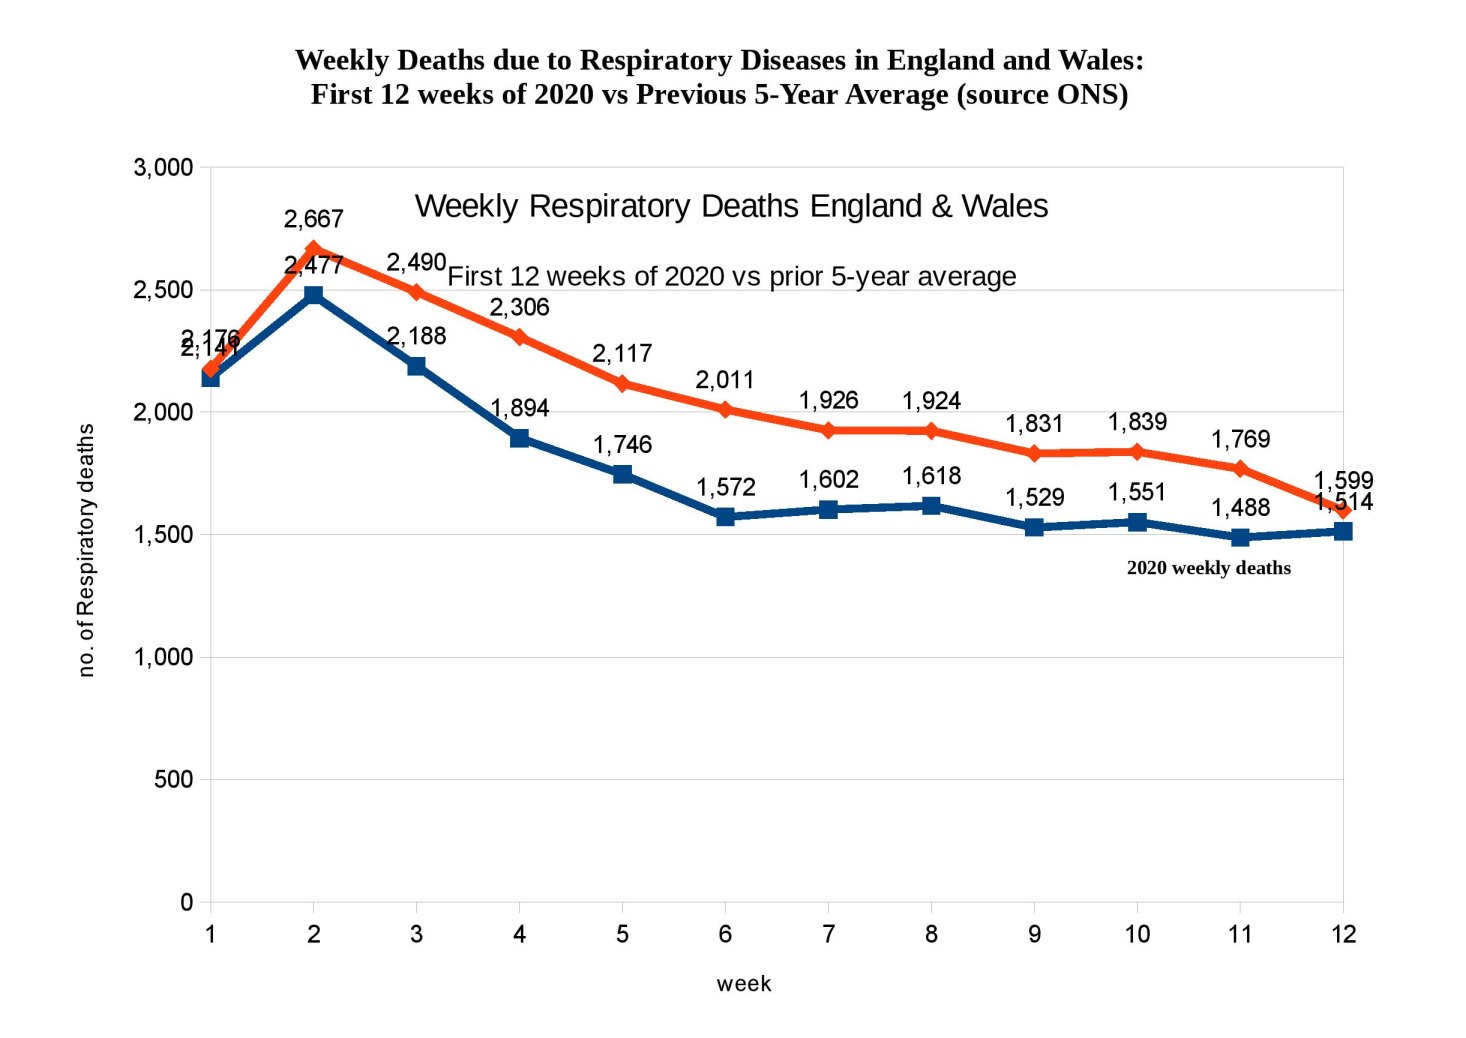
Note that this graph, like David’s, includes the ONS’s changed — increased — figures for Covid-19 deaths for March. If you compare it to the graph he did previously (see my earlier post) you’ll notice that the 2020 respiratory deaths were lower for some weeks in March than on this graph. Now they’re bigger, partly because of the new rules, and partly because some more death certificates have recently come in from private houses and care homes for those periods.
Has this made a big difference? No. Has it made much of a difference at all? No. The Covid-19 numbers just aren’t that big compared to daily deaths, even if we’re just talking about respiratory deaths. As you can see, 2020 has still had less respiratory deaths every week than the five-year average.
And now Robert’s other way of presenting this data. This time it’s the cumulative respiratory death totals for England and Wales, versus the average for the past five years. Cumulative means that we add each week’s figures to the current total, rather than just presenting each week on its own. Again, this includes ONS’s changed (increased) figures for C-19 deaths for March. (Click to enlarge.)
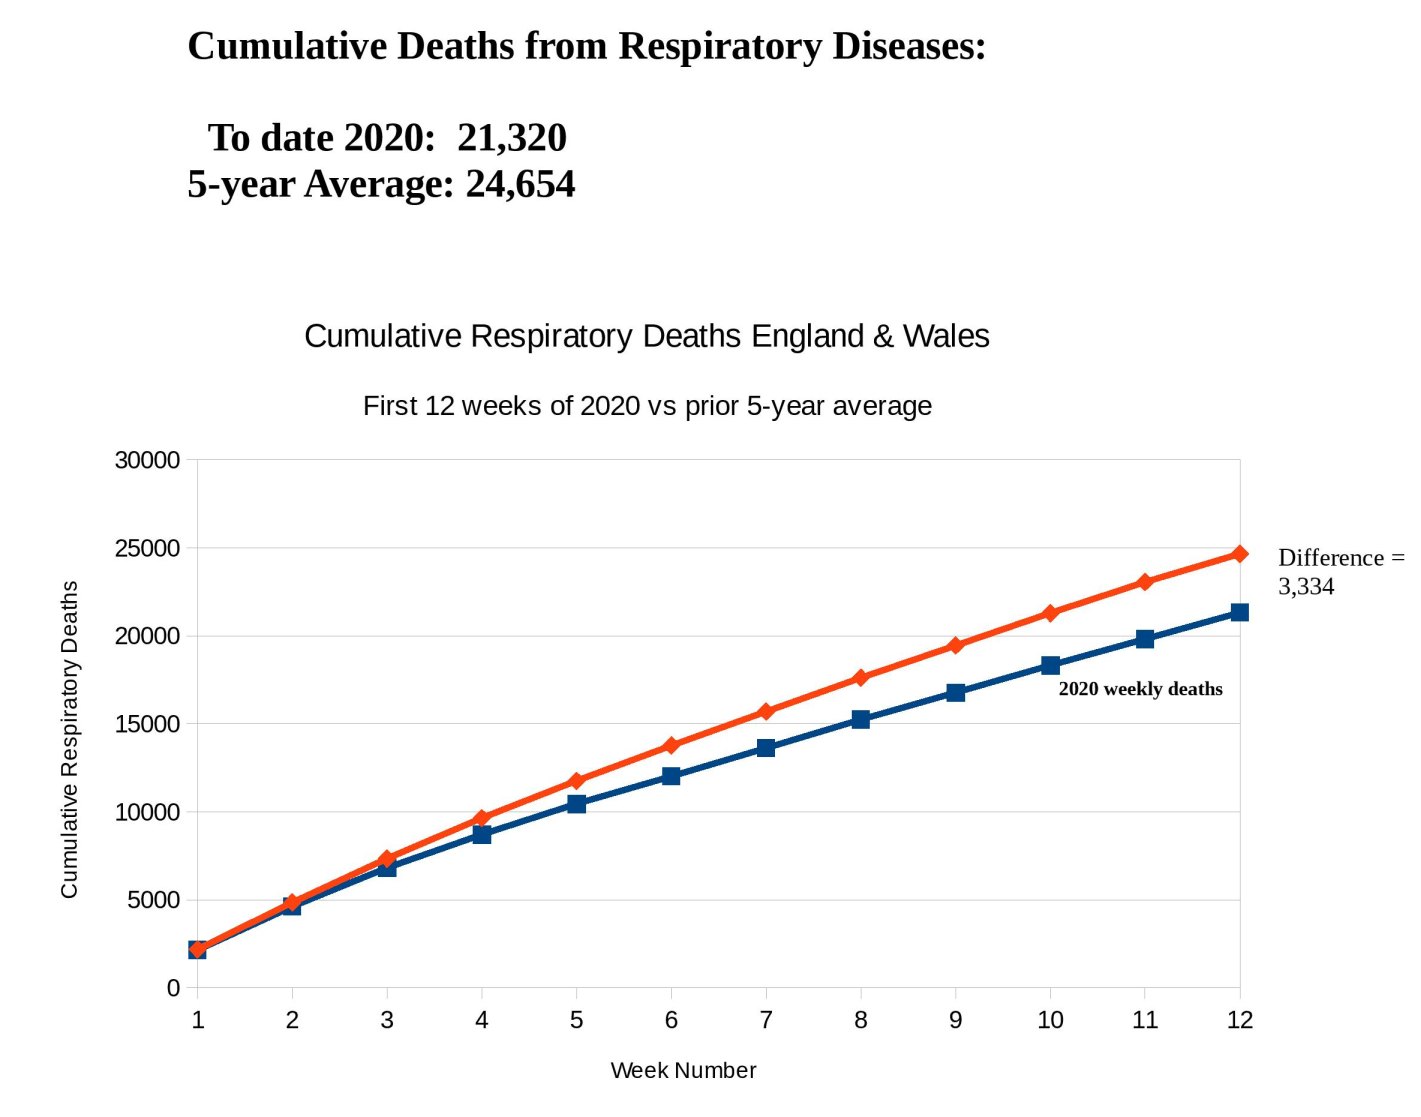
The last graph Robert did of the cumulative deaths had the stats up to the end of week 10. Some people said ‘Wait two weeks, exponential growth, oh my God it’s going to be bad’. Well, these are the stats for two weeks later, and guess what? It ain’t bad. In fact, it’s even better than last time. Despite all those dubious extra Covid-19 deaths they’ve shovelled into the stats, the gap between 2020 and the five-year average actually increased. There were, at the end of week 10, 3004 less respiratory deaths this year than the past five years, but at the end of week 12 there are 3334 less deaths.
We can only conclude that Prof Neil Ferguson is like some trigger-happy Hollywood baddie unloading shells at phantoms in the jungle, and achieving nothing except blowing up unusual clumps of banana trees and a noisy bands of parrots and chimps.
Thanks again to David and Robert for making these graphs. We’re all very grateful to them. But I think their attitude is, it’s no big deal, us pros know how to do these, lots of people can do this sort of thing, so why isn’t the ONS doing it?
Update: Notes from the ONS data:
———————-
Weekly death figures provide provisional counts of the number of deaths registered in England and Wales for which data are available, and the number of deaths for which the underlying cause was coded to respiratory diseases as defined in the International Statistical Classification of Diseases and Related Health Problems Tenth Revision (ICD-10). From 31 March 2020 these figures also show the number of deaths involving coronavirus (COVID-19), based on any mention of COVID-19 on the death certificate.
Provisional data on deaths registered in each week (ending on a Friday) are compiled at the end of the following week.
Bank Holidays could affect the number of registrations made within those weeks.
The counts of deaths from specific conditons are updated with each weekly publication as the coding of the underlying cause is not always complete at the time of production.
To meet user needs, we publish very timely but provisional counts of death registrations in England and Wales in our Deaths registered weekly in England and Wales, provisional dataset. These are presented by sex, age group and regions (within England), as well as for Wales as a whole. To allow time for registration and processing, these figures are published 11 days after the week ends.
Because of the coronavirus (COVID-19) pandemic, our regular weekly deaths release now provides a separate breakdown of the numbers of deaths involving COVID-19. That is, where COVID-19 or suspected COVID-19 was mentioned anywhere on the death certificate, including in combination with other health conditions. Previously, the number of deaths with an underlying cause of respiratory disease was published a week behind the current week. These will now be published for the current week and revised the following week. Alongside this, a new bulletin summarises the latest weekly information and will be updated each week during the pandemic. A link to the bulletin can be found in the notice box on the weekly deaths dataset page.
———————-
34 thoughts on “Updated graphs of … nothing much”
“We can only conclude that Prof Neil Ferguson is like some trigger-happy Hollywood baddie unloading shells at phantoms in the jungle, and achieving nothing except blowing up unusual clumps of banana trees and a noisy bands of parrots and chimps.”
If it were only shells. The effect he’s having on the UK economy is more akin to a thermo-nuclear attack.
When this is all over he needs to be prosecuted for the damage he’s done to tens of millions of people’s lives. We need to send the ‘expert’ community a message – you better be damn sure of your prognostications, because if you’re wrong you’re going to pay for it personally.
Incidentally Zerohedge has some interesting Italian death stats:
https://www.zerohedge.com/geopolitical/whats-behind-italys-outrageous-10-mortality-rate-covid-19
My overall take.
With access to first world medicine the death rate is nothing much.
Without it the death rate becomes significant.
China is mostly a third world country but with pockets of first world within it, so when the first world part of the healthcare system got overloaded the death toll climbed.
Iran is the same but with less significant first world pockets.
Italy is better provided with healthcare than either, but by first world standards not very good.
The effort is to ensure that first world treatment remains for all British cases. How big a risk that is is hard to tell, and we can expect the health professionals to milk the situation.
There is also the problem of dealing with panic, probably better achieved by doing something and getting the public to do something than by telling the public to calm down with the media screaming panic.
Hector writes: “So there is no sign whatsoever of a killer in that data. It’s a perfectly normal year.”
UK deaths from COVID-19 as reported with one-day time lag in Wikipedia:
Week 10 (W/E 06 March): deaths 2
Week 11 (W/E 13 March): deaths 8
Week 12 (W/E 20 March): deaths 167
Week 13 (W/E 27 March): deaths 842
Week 14 (W/E 03 April): deaths N/K
Accordingly, given plots based on ONS data have no released data points until after a 1+ week delay and then another week or two for the straggler death registrations to come in, we would surely not expect those many plots to 2020 Week 12 (prepared by David Clark and Robert Watson) to show much of a noticeable up-tick from COVID-19.
There might well be an up-tick when 2020 Week 13 data is included. There will be no up-tick if the 842 (or so) were going to die in Week 13 without COVID-19. There will be a marked up-tick if none of them were going to so die in Week 13.
In-between up-ticks might well be indicative of the trend going one way or the other from ONS data. Let’s hope that Week 13 data does better for those of us who are inquisitive but recognise we are not fully enough informed. Otherwise we will be waiting for the score from Week 14.
Reminds me a bit of 1960s Saturday afternoons, waiting for the football results on Grandstand.
Best regards
Indeed. Lest we be accused of moving the goalposts, that’s more or less what I said the other day: the week 11/12 data will be interesting (and indeed they are, for all the right reasons), but it’s April that will begin to tell the real story.
Of course, as Pat says above, the chances of dying from this thing are directly related to healthcare. The UK has doubled its ICU capacity over the last couple of weeks. The battle, when this is all over, will be in determining whether that alone was what saved lives, or whether the draconian lockdown made any contribution at all. (I’m reminded of the “Millennium bug”: now a byword for a fuss over nothing, it was a genuine problem, and disaster was only averted because of the massive effort put in to avoid it.)
My gut feeling is that, at least at this stage, it’s probably bought the hospitals some time to prepare; there’s no doubt that over the last week or so the exponential growth in the number of cases does indeed seem to have “flattened” somewhat. The question is whether the projected three to six months of this will be worth the cost.
>I’m reminded of the “Millennium bug”: now a byword for a fuss over nothing, it was a genuine problem, and disaster was only averted because of the massive effort put in to avoid it
I often hear this, especially from IT guys, but is it true? Has a proper study been done? Because I’ve also heard that there are cases (firms, countries) that did nothing, and nothing happened. Don’t know which is true.
>the chances of dying from this thing are directly related to healthcare
But that’s true of many diseases. Also, the stories of the NHS being overwhelmed have been somewhat exaggerated.
>there’s no doubt that over the last week or so the exponential growth in the number of cases does indeed seem to have “flattened” somewhat
There is considerable doubt over the ‘exponential growth’ that was supposed to happen. The C-19 numbers are very unreliable. The data that the projections are based on is flimsy. We have no idea where on the bell curve we really are, and we have to take into account the considerable statistical noise that you get with such things, and especially this one (as it’s new, and we don’t really know what’s happening).
Any ‘Investigative Journalist’ worth their salt should be all over this like a rash. Instead we are hearing social distancing measures could go on for many months yet.
On the millennium bug. I remember talk about it as a data processor back in 1974. In my view it was talked up out of all proportion and, as noted by Pat above re WuFlu “we can expect the health professionals to milk the situation”. Not to mention everyone else with a bee in their bonnet or snake-oil to sell.
I am not unduly concerned about the ONS classification, the explanation given on their blog is reasonable. If every death ‘with’ is noted then unless there is double counting deaths from other causes must decline. Either there will be a notable spike in the overall death rate or it has been a panic about nothing much.
The 85+ rate in particular is very variable year to year. If there wasn’t a test for this particular virus then so far it would be have been invisible. Even if there is a bit of a blip in the next few weeks that would not be out out of the ordinary; we have had a mild winter, now a cold snap.
Tony, I doubt any ‘Investigative Journalist’ has the skills to actually look at the ONS figures, let alone graph them in a way which might inform their viewers and I doubt that the major news organs, (including the BBC), have anyone on staff that could do this. (Maybe some lowly techie somewhere but who knows.)
No, our brave journos chief skill is in taking a handout from a source and spinning it to suit their agenda. Well that and asking gotcha questions at press conferences.
Since the purpose here is clear thinking, it would be useful to put a parameter (error bar?) that would indicate a change from “nothing much” to “something significant”. What should we be looking for that would falsify “nothing much”?
(quote marks not sneery!)
The Euromomo figures linked to yesterday have some sort of significance bars on them, the UK is still under its average for the time of year. It would have to rise by a huge figure weekly to even breach the first upper bound of ‘normality’.
I have to admit I cringed when I read that back. “Disaster” wasn’t averted in 2000. I don’t know why I said that. I’m not good at mornings (even late mornings). But it would certainly have been a significant, if not world-shattering, problem had action not been taken.
And, really, my point isn’t so much that problems don’t look so bad in hindsight as that in a global situation like this, after the event it can still be hard to determine whether the measures taken were proportionate or even necessary. That argument will drag on even when we have the full picture. If (as I still hope) you’re right, and this proves to be no worse than any other seasonal disease, it will be said that it was due to the lockdown and “social distancing”. If it does turn out to be the zombie apocalypse the news media seem to want it to be, it will be said that it could have been even worse. I suspect the truth will be somewhere in between.
“There is considerable doubt over the ‘exponential growth’ that was supposed to happen.”
I don’t disagree. What I meant was that the numbers have undeniably been fairly stable for about six days, after a period of what looked very much like exponential growth with a doubling-rate of as perhaps little as three days.
Now, whether that’s due to the lockdown or statistical noise is open for debate and, as I say, I don’t think we’ll know that for a while yet. I actually deleted a paragraph about how both Italy and Spain saw a “pause” in exponential growth around 2-3,000 cases per day too.
PJF
My attitude to statistics is that if I can’t find a way to present it in a way that is obvious using a simple honest graph then there probably isn’t anything significant. I try to distance myself from colleagues who spatter their papers with talk of confidence intervals and such like.
Look at that death-by-age-group graph. The young deaths are pretty constant, the only down dip is because the registry offices (and all the services that will need a death certificate) are closed for several days at year end. The 85+ deaths are very seasonal and you can see year on year it is variable —’noisy’. So when that current year line bursts through that noisy band of normal for this time of year, especially for the not so old. then it might be ‘something significant’.
But significant of what? A particular strain of ‘flu? A health system overload? A misdirected overload, to be discovered when deaths from all those conditions which were not treated in a timely manner because the GP was not answering calls, or worsened because patients were discharged too soon in order to free up capacity? Or the very hard to quantify costs of lockdown: economic and social ruin? When the dust settles I suspect a lot of people, especially politicians, will claim credit for things not being as bad as hyped while being very quiet about some very real and lasting damage.
It has been a mild season so far, perhaps there is a pool of elderly at risk right now[*].
[*] https://www.zerohedge.com/geopolitical/whats-behind-italys-outrageous-10-mortality-rate-covid-19 is an interesting speculation.
Re: “Millenium Bug”
As someone with several decades of software development experience, my view is that this was an issue, but not for the obvious reasons. Systems were vulnerable to this issue for one of two reasons:
1) The system was in use longer than its designers had intended – effectively being “used out of spec.” (representing an under invesment in technology infrastructure)
or
2) The system was developed by engineers who did not foresee the issue: Either they coded the assumption themselves or they did not bother to check the assumptions present in the libraries and/or hardware they were using. Such incompetence is unlikely to be uniquely expressed in that flaw – the system was probably never fit for purpose.
In neither case was the problem related to the roll-over in dates – that was merely the catalyst for discovering it.
Reason 2) is particularly relevant in the context of using software models to predict the behaviour of the climate or the behaviour of a new virus in a population. Based on my recruitment experience, my estimate of the proportion of competent software engineers among those seeking employment is ~30%. That estimate decreases for the proportion of those from other science disciplines who end up writing software. Some are truly excellent, but many more have a “how hard can it be?” attitude worthy of Sheldon Cooper, and the school-boy errors they make are often staggering.
Some public examples:
https://www.theregister.co.uk/2019/10/15/bug_python_scripts/
https://theconversation.com/the-reinhart-rogoff-error-or-how-not-to-excel-at-economics-13646
I think any software model that is used to justify significant policy “for the public good” should have its source code freely available to the public as open-source, along with all necessary data and scripts to allow it to be properly examined by those of us who have a better understanding of the sorts of errors that humans are prone to making when attempting to control machines.
(i) “Cause of death” is an intrinsically arbitrary idea unless you’ve chosen to be hit by a bus, or the like. Or, at least, it’s intrinsically arbitrary for codgers already suffering several potentially lethal illnesses.
(ii) Buying time for the hospitals to get their acts together also buys time for work on treatments and vaccines.
Although I’m sure, and always was, that people underrated this to start with, I suspect they are overrating it now. But I hold that latter view with low confidence because there’s not a lot of certainty available for such a new disease.
By “overrating” I refer to the signs of people resorting to panic rather than to clear analytical thinking.
Dearieme
Yep
I wonder whether the truth is that the Corvid 19 virus converts a death that would shortly have happened anyway in a quiet hospital bed to one that requires the emergency application of additional oxygen or ventilation so that that particular speciality becomes overwhelmed whilst it is quieter than average elsewhere within the health system.
It is true that such a respiratory illness will also cause deaths outside the category of those shortly to die anyway but that happens all the time in any event.
My wife lost a best friend to pneumonia when she was in her 20s so such deaths are a regular if sad occurrence.
Could this whole panic simply be a consequence of an overall shift in the immediate cause of death from one that does not call for ventilation to one that does ?
I’m sure that adding Corvid 19 to the normal disease burden will increase overall death rates to some extent but not sure that it will increase those rates to a level at which disruption of the global economy is justified.
“Could this whole panic simply be a consequence of an overall shift in the immediate cause of death from one that does not call for ventilation to one that does ?”
Possible. A large part of this is stoked by breathless reports from ‘doctors’ inside ICU’s talking about exhaustion, chaos and mass overload. Elsewhere, hospitals seem very quiet.
“Amazing how few people here have noted how dismissive of this disease so many of Trump’s Leftist critics were:”
I think it’s more accurate to surmise it as “To save the village, we had to destroy the village”, just applied to an entire nation.
I’ve been studying the ONS data since Tuesday so this work is going to save me the hassle going forwards – and is more comprehensive to boot. Thanks.
The economy IS being trashed and every week is critical.
Diamond Princess offers the nearest thing we have to a control group, and while it’s bad, the data doesn’t look sufficiently terrifying to justify economic Armageddon.
Tuesday update will be fascinating. I am expecting an uptick on trend BUT I’m also expecting a “pull forward” as well as a “catch-up” (below trend winter). Lies, damned lies, but the truth will out, eventually.
Highly recommend this;
Perspectives on the Pandemic | Dr John Ioannidis of Stanford University
https://www.youtube.com/watch?v=d6MZy-2fcBw
“(I’m reminded of the “Millennium bug”: now a byword for a fuss over nothing, it was a genuine problem, and disaster was only averted because of the massive effort put in to avoid it.)”
I was a software consultant during this time, hardy anything had to be fixed on the system we “saved”, it was indeed a fuss over nothing; although very lucrative for us, clients were billed phenomenal markup for “Y2K Audits”, the term we used was “shooting fish in a barrel”.
I’m 99.9% sure that Mrs. Bloke In Cyprus had this in the UK in November. There are many others that are reporting bad flu like symptoms at that time.
If that is true, and WuFlu is as bad as claimed then it should have decimated the World’s population by now.
I too had a flu like virus around Christmas, that went straight for my chest and left me breathless, and coughing incessantly. Its ludicrous to think that patient zero in the UK was the first person who tested positive for CV. Chances are its been floating around for several months at least prior to being officially ‘discovered’.
Well, there is a simple test here. They claim it is both highly contagious and deadly. It was first detected in December in China, so was likely on the loose November.
Given the former claim, it defies belief that it is not worldwide prior to the restrictions being placed on western countries. therefor it cannot be as deadly as claimed.
BiC
Friend of mine has reported an interview with a Real Virologist, who says that there was indeed an horrid wave of respiratory infection going about November to January all over the place, but that (alas for us) there’s no evidence to suggest it was COVID19.
If you die of a heart attack, you can’t die of cancer, and vice versa. Similarly, if there is a rise in(say) Wuhan Flu, and there isn’t a killer bug, then we should see a fall-off in deaths from other causes, particularly the great killers. Thus, I suggest plotting the deaths from other causes relative to the deaths from Wuhan Flu and the normal yearly averages, then we would see very clearly the reporting bias.
I’m lucky in that I normally work from home freelance now that I’m retired from a salaried job, and so the lockdown isn’t having much of an impact economically, but for others this is a disaster.
Here’s a prediction. They’ll fake the global temparature record and say that the lockdown slowed Global Warming so we were nett gainers …
This is a dangerous and misleading analysis.
On the 20th March, the total death count was only 177. Why would you ever expect that to show up on a chart with a scale from 0 to 9000?
14 days later, the weekly death toll is already in the thousands. Of course it will show on your chart then.
I’ve just discovered your blog through twitter (thank goodness for twitter, I am getting all my non fake news there.) The quality of information is excellent, thank you very much for your work. I will be sharing your blogs on social media.
Official daily death figure for 3 April is 634. If all of those were EXTRA deaths, solely attributable to covid-19, then yes they would show up. If they are deaths that, for the most part, would have occurred anyway, if not WuFlu then some other flu, then they won’t make much impression even on the respiratory deaths scale, which so far has been below trend this year.
Classifying every death ‘with’ or even suspected as a covid-19 death will bump up the respiratory deaths (I assume covid-19 to still be included in that category), Probably to the point of making headlines.
Which is why the All Deaths, and the Seven Ages chart are important to put this in perspective.
There are 7 days in a week
For the sake of balance, I think it is worth taking note of how many NHS staff have died of coronavirus or died after testing positive for coronavirus.https://www.telegraph.co.uk/news/2020/04/07/nhs-staff-died-coronavirus-frontline-workers-victims/
That’s 20 of them. It’s not insignificant, and these are people who were being VERY careful.
Mr. Holmes — We should always be balanced. And we should always be open-minded. There is clearly a lot we do not know about the current situation. However, we know enough to know that nationwide lockdowns are the wrong response, and we know enough to know that we should be focusing much more efforts on protecting the old & the medically-compromised, who are the people at risk.
Certainly, we should all be very grateful to the medical professionals — especially at a time like this.
Can I simply register a little surprise about the Telegraph’s list of deceased NHS staff. First, 8 out of the 20 were 65 or older — people who should have been protected from infection, not put into the front lines. Second, at least 13 of the 20 were not born in the UK. Is that representative of the NHS? Why is the UK apparently having to import trained staff to run the NHS?
Stats is an artform. There is a quote ‘ there are lies, damned lies and statistics’ which exemplifies this and which this article plays to.
The exact same figures that this article uses, updated to the last week of April is shown here https://fullfact.org/health/ons-2020-covid-death-totals/. The spike at the end of April is pretty obvious – but of course, it is nothing to do with covid-19
Comments are closed.