I’ve been looking for the weekly or monthly Italian death stats (all deaths, not Covid-19 deaths). Looks like they are not publicly available, which is rather remarkable. Even the Italian National Statistics Institute doesn’t publish them, although I expect they have them.
EUROMOMO
However, this site has been mentioned by a few people on the internet (and also by one of my commentators): https://www.euromomo.eu/
It’s a group called the European Monitoring of Excess Mortality for Public Health Action.
It has official death stats for a large number of European countries, including Italy. One of its partners is the Istituto Superiore di Sanità, which according to Wikipedia is “the leading technical-scientific body of the Italian National Health Service“, so we can presume it has the real Italian stats (in as much as, cynics might say, there can be real stats for a place like Italy).
Euromomo don’t publish a lot of stuff on their site, but they do have some interesting graphs.
Netherlands
Before I go, let me note that no excess deaths are visible yet at a European-wide level, in any age group. In fact, current deaths are at very low levels.
But, you may say, we wouldn’t expect that at this stage. So let’s look at the countries first.
The graphs for individual countries are quite small and it’s hard to see what’s going on, so I’ve blown them up for you. Here, for example, is the Netherlands (click to enlarge):
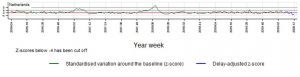
I cut and pasted the footer at the bottom of the page to this graph, so you can see what’s going on. The ‘2019-16’ type numbers right under the graph refer to the year and the week of that year (some of these numbers are a bit hard to make out). The graphs go back about four years.
Z-scores
What the graph shows is z-scores. What’s a z-score? Well, first of all you work out the average number of deaths in that country for a day, or a week, or whatever. This is called the ‘baseline’, and is represented by the red line. (Euromomo base their baseline on the last 4 1/2 years of data, and it looks like they base it on certain parts of spring and autumn, rather than the whole year.)
Then you graph the real daily figures as a line around the baseline. When the daily (or weekly figures, depending on what they’re using) are over the baseline, the line gets higher. When the real figures are lower than the baseline, the line goes under the red line. In effect, you see when things diverge from the norm (as often happens in in winter, when we normally see more deaths).
(Apologies to those for whom this is very basic.)
So with the Netherlands we can see that generally things have been pretty normal for the last four years, but there were some spikes in winter 2016-17 and 2017-18, which is quite typical of winter, although there weren’t excess winter deaths in winter 2018-19. But look now at the last right-hand bit of the graph, winter 2019-20. Hardly any spikes in the data for that period. No sign at all of the scariest soil-your-pants epidemic in a century there. In fact, the last few months have seen the deaths falling to pretty low levels.
Big deal, you might say. We know Covid-19 is not doing much in the Netherlands so far. But it might later on. (In actual fact, though, you’d have to see an awful lot of deaths for that graph to get anywhere remotely scary levels.)
Italy
Anyway, let’s look now at Italy, because this is where the biggest horror story is supposed to be right now (click to enlarge):
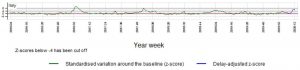
Look at the last right-hand bit again. This time, we have something. There’s a pronounced uptick in the last few weeks (it looks like the stats go up to the middle of last week). This is presumably a sign of Covid-19 killing people. But far from being an unprecedented slaughterhouse direct from Stephen King’s imagination, we’re still not seeing anything out of the ordinary. Winter 2016-17 and 2017-18 were worse. Of course, Italy may get worse still, and probably will for a few weeks, but as we can see from all these European graphs, a high number of extra deaths due to communicable disease after mid-spring and through summer is basically unknown. Summer heatwaves sometimes kill extra people, but communicable diseases very rarely do.
That doesn’t mean it can’t happen this time, but it does mean that we would need very good evidence to the contrary to justify shutting down the world’s economies. What’s more likely is that we”ll have a recurrence in winter 2020-21 in some parts of Italy, perhaps a somewhat bad one, for which the Italians should ready their health service for. And perhaps it makes sense to have some mitigation strategies in place in in vulnerable parts of northern Italy now. But I’m still not seeing anything resembling World War 3. (Remember that Italy is supposed to be where everything is happening right now, not in two weeks time.)
It can also be seen that most of this increase in the death rates in Italy is due to increases in deaths of over 65s. Click on the >=65 years button at the top of the page at euromomo to see this, and compare it with the other age groups.
United Kingdom
Let’s now take a look at the UK, which is divided up into its constituent countries (click to enlarge):
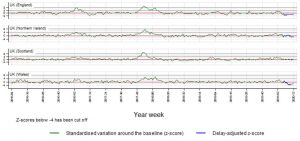
Nothing whatsoever to see here. All totally normal. Not even any recent upticks. This all accords with the recent UK graphs two of my readers have done. Wales is currently even lower than normal.
There have, of course, been some UK Covid-19 deaths since the middle of last week (which this graph goes up to), but even if they really all are excess deaths, the numbers are way too small to make much difference to these graphs.
Europe
You might still think, despite everything I’ve said, that the apocalypse is defintely coming for us this summer. Here’s one more Euromomo graph to look at in that case (click to enlarge):
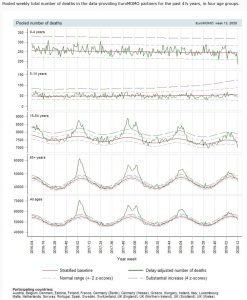
(Note that these are death numbers, not z-scores. I don’t know how they’ve calculated the baseline here, but they’ve done it for each age group.)
What do you notice about this? Well, for one thing, the numbers for the kids are fairly straight lines (on average), whereas for the adults, it’s a series of waves. The deaths go up in winter, and down in summer. It’s this wave-like effect that is important, especially with Covid-19, which kills almost exclusively adults, not kids. I expect you would see something similar pretty much every year with Western countries (apart from the World War I and II years). (If anyone has a link to such graphs, please post it in comments.)
A communicable disease epidemic in summer is really, really unusual. So unusual that I don’t expect it to happen, and in the absence of rock-solid evidence that it will, we should expect things to die down in a few weeks or a month. That’s one reason — not the only reason, but one important reason — why you shouldn’t freak out over claims of exponential growth that are just around the corner.
Update: We have more revealing graphs coming in to put up for you tomorrow. Keep ’em coming.
23 thoughts on “Some European death graphs”
Big jump in the deaths figures coming today as the UK is adopting Italian record keeping standards:
The figures due out in the coming hours are based on the number of deaths registered ‘where Covid-19 is mentioned anywhere on the death certificate’.
Hit-by-a-bus whilst Covid-19 positive? -> Coronavirus death.
Isolation suicide whilst Covid-19 positive? -> Coronavirus death.
Edited to add link:
https://www.dailymail.co.uk/news/article-8170065/UKs-coronavirus-death-toll-HIGHER-official-figures.html
“True”
The problem with these data is that they are flawed. Unless a pathologist has certified that the patient died owing to infection with COVID-19, ie it killed him/her then fine. But just because a patient is infected and dies does not mean the virus killed said patient. It may simply have exacerbated any underlying condition such as kidney or liver failure. Plus we still do not know the level of infection. Until we do know we are guessing at mortality rates and such rates are muddied by the situation above. There is a degree of panic setting in about this normally mild respiratory disease.
“Of the 10,645 deaths registered in the week ending 20 March, 103 mentioned #COVID-19 on the death certificate”
https://twitter.com/ONS/status/1244905924000731136
“Covid-19 deaths Up, Flu deaths Down”
I think (hope) that the problem that COVID19 poses that flu does not is that COVID19 **treatment** is horribly expensive in health system resources.
As I noted the other day, if Cuomo is to be believed, COVID19 patients in ICU can be on a ventilator for 10-25 days. Typical times for other maladies are said to be 2-3 days.
So COVID19 occupancy of the health system is of the order of 10x more than otherwise equally lethal maladies.
And the panic is about capacity, not deaths.
Deaths would be much much higher sans capacity.
In which case do as the Yanks are and dose with Hydroxy-chloroquine + Azithromycin
If you can keep people out of ICU then they don’t consume those resources.
I still get the general impression that the UK establishment is slow walking Chloroquine remedies as they don’t want a crisis resolved quickly.
From which country.
ONS figures for England and Wales record 103 COVID-19 week 12
The point its surely that there is a large element of arbitrariness in the cause of death assigned to a codger with many illnesses. This is a universal truth, I expect, putting aside such unambiguous categories as “hit by a bus”. Therefore cause of death is vulnerable to fashion – perhaps the fashion of the medical schools and hospitals where the doctor trained, perhaps the fashions of the hospital he works in, perhaps the fashion of his generation, perhaps the fashion of the panic of the day.
Is there a way around it? Probably not: Pilate might be sound on this.
“Deaths would be much much higher sans capacity.” Maybe, but that’s not what the Wuhan figures imply for ventilators. See Table 2.
https://www.thelancet.com/action/showPdf?pii=S0140-6736(20)30566-3
Dearieme
Thanks for the pointer.
I see that in Table 2 ‘Hospital length of stay’ is 9-15 days for survivors. That’s shorter than Cuomo, but it’s still more than ‘typical flu’ (assuming Cuomo got that bit right)
It’s 5-11 days for non-survivors, essentially all of whom were put on some mechanical breathing assistance. Survivors didn’t need them.
I therefore stick with my interim conclusion that this stuff kills people, but that the reason for lockdowns and similar is to ease capacity strains.
I think there’s ample reason to investigate such remedies, and enough that if it’s that or dying, why not give it a whack. But there’s as yet no data I’ve seen which says it’s a good prophylactic for the general population.
Videos all over youtube showing hospitals across the world, including UK, lying empty – not overrun with CV cases as we’re being fed by the MSM. What the hell is really going on?
Bitin ?
Enough Anecdata piled up eventually becomes evidence.
Although not a proper peer reviewed study that takes until the next flu season to complete.
Note: It’s not a prophylactic dose being given to the whole pop, those likely to fight it off are given a Lemsip, this doctor is treating the higher risk groups before they need to go to IC.
Also not too worried about it killing people immediately, it was used by almost every Gwailo in Vietnam for instance.
https://www.thegatewaypundit.com/2020/03/stunning-ny-doctor-vladimir-zelenko-finds-100-success-rate-in-350-patients-using-hydroxychloroquine-with-z-paks-video/
To clear up acute care beds here they have moved patients to long term care facilities, which seems odd as the majority of the deaths so far here have been from outbreaks in long term care facilities.
I recommend reading “Extraordinary popular delusions and the madness of crowds”.
Still no information on what supply status of Hydroxy-chloroquine + Azithromycin is in the UK
Trump has directed the FDA to prioritise its use, France and Belgium are pushing its use. The UK has banned export since 19th Feb.
So how much has been prescribed, to how many people and what are the results.
Heads will roll if the establishment have slow walked this and people are ending up in intensive care instead of getting a curative course as in the example below.
https://www.thegatewaypundit.com/2020/03/stunning-ny-doctor-vladimir-zelenko-finds-100-success-rate-in-350-patients-using-hydroxychloroquine-with-z-paks-video/
Although it’s extremely useful in having a handle on the figures, does anyone have a view on the chaotic scenes shown in Italian (and even US) hospitals? Also where 20+ dead of CV in just one London hospital? It does seem counterintuitive with the low numbers highlighted here.
A little bit more specific reports for Italy can be found from the link below. I assume they will update it once a week.
Probably country administrations are getting more detailed reports from Euromomo than public.
http://www.deplazio.net/en/vai-alla-pagina-delle-news/340-2020-03-31-09-24-41
…anyone have a view….Also where 20+ dead of CV in just one London hospital?
Approximately 2,000 people die per day in the UK in Winter, and about 1,400 in Summer. There are about 1,250 hospitals in the UK. So each hospital should expect 2 deaths per day if things were evenly balanced.
Of course, they are not. 10 deaths per day might be not uncommon. It will depend a lot on hospital size, speciality, etc.
If you are wondering about ’20+ dead in a London hospital’, the best guess about what you are referring to that I can come up with is a Guardian Report saying “…This includes London North West Healthcare NHS trust, which recorded a further 20 deaths..”
The London North West Healthcare NHS trust comprises 6 hospitals, 2 hospices, and 25 further clinics, health centres, etc. Just taking the hospitals and hospices, that means between 2-3 deaths per day at each location. That is pretty much an exact average of deaths to be expected with no epidemic.
All that has happened is that the deaths which would have happened anyway are recorded as Covid.
“Is there a way around it? Probably not: ”
I believe that there is, though it’s clumsy and somewhat delayed.
Use the Total Mortality stats.
These stats are unambiguous, and will be precise. They will not tell you which deaths Covid is responsible for, but WILL show you if there are any excess deaths.
Excess deaths is what we should be worried about, and in the circumstances, we can attribute these to Covid…
“All that has happened is that the deaths which would have happened anyway are recorded as Covid.”
Very well said, Dodgy Geezer! The At Risk population — elderly, medically-compromised — is at risk because they are already in Heaven’s Antechamber. The bureaucratic practice of saying that all those who die testing positive for C-19 died from C-19 is obfuscating reality — although it is useful to the Political Class for justifying the burdens that shutting down the economy is putting on the vast number of healthy people.
Comments are closed.