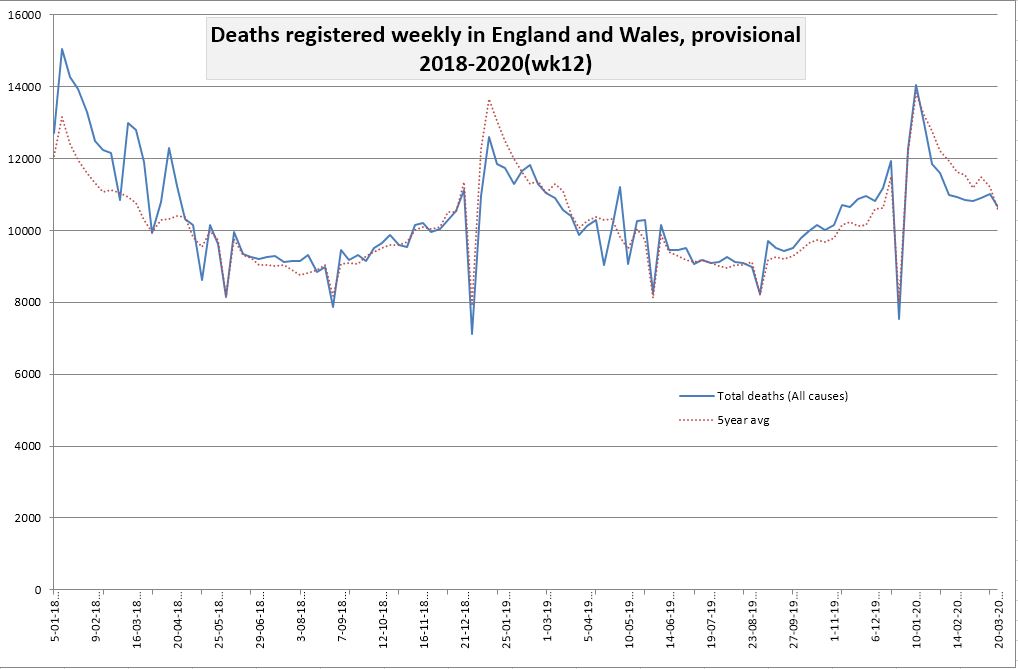
Another of my readers, Laurence Hodge, has done a graph for me. This one charts deaths from 2018 to the end of week 12 of 2020 (this is the blue line), with the the five-year average plotted as red dots for comparison (click to enlarge).
Figures from the ONS.
Share this article on social media:
16 thoughts on “2018-2020 graph”
I’ve seen lots of graphs that show deaths up to week 12. I don’t see how relevant they are when we only had a couple of CV19 deaths recorded by that point.
Matt, we didn’t have ‘just a couple’ of deaths by that point.
Covid-19 was first recorded in mid-November in China, and was quite likely around even earlier than that. Large numbers of Chinese travellers, and others who caught it, have been spreading it for months. We’re told that’s it’s relatively infectious. So after almost 5 months you would have expected to see something in the death stats if it really was World War 3. But all we keep hearing is, ‘Oh, it’s the next two weeks that the horror show will start’.
Also, the closer we get to summer the less likely it is that we’ll have mass deaths, because (1) coronaviruses typically die down over summer, and (2) it’s very rare to have large numbers of viral deaths in Europe in summer.
The first confirmed cases (2, IIRC also connected) of COVID-19 in the UK were both recorded on 31st January 2020. By 29th February, a further 21 cases had been confirmed in the UK. The first death in the UK (as attributed in an NHS hospital and presumably appearing somewhere on the Death Certificate) occurred on 5th March.
I am sure that I agree with Hector that the prevailing government view should be subject to severe scrutiny; and this should be ongoing – until much greater knowledge on the issue is available – making the issue beyond further reasonable dispute. But I don’t see why his view should be accepted without any supporting evidence.
Is there any supporting evidence? I would be reasonably content to accept any retrospective revision of death certificates, changing the principal cause away from COVID-19. Are there any?
Even Hector’s phrasing of it as a ‘World War 3’ scenario (my preferred phrasing is exponential growth) actually starts with one diagnosis (or a small connected group of diagnoses) either before, at or not long after the time of any deaths.
Best regards
Do we have figures for later weeks? It should be straightforward to include them.
Hector,
Any idea why the stated number of recovered cases in the UK (according to Worldometer) has remained at 135 for over a week now?
Whilst the total number supposedly infected in the UK has risen to 44,000 today, that 135 number has remained stationary.
Carelessness or damned lies etc…?
Nigel S. “But I don’t see why his view should be accepted without any supporting evidence.”
There is no reason why anyone’s view should be accepted without supporting evidence. Yet without much in the way of supporting evidence, our overlords have chosen to knock the economy for six.
We know the flu comes every winter and accelerates large numbers of old or sick people around the world into Heaven — and we tolerate that, just as we tolerate the large numbers of people around the world dying in traffic accidents. What is the evidence for treating this particular virus any differently?
During a period in which over 1,500,000 Chinese people died from all causes, only about 3,000 deaths were ascribed to C-19. OK, no-one believes Chinese data.
When the virus was allowed to run rampant on the Diamond Princess loaded with a disproportionate number of susceptible people, only 10 died out of nearly 4,000 — and those were all very old and/or medically compromised.
The scare is not based on evidence — it is based on forecasts. The burden is on the forecasters to prove that we should take their forecasts seriously.
Strange isn’t it, thousands of cases detected but, unlike anywhere else, few recovered. Perhaps there is some official hospital definition of recovered — signed off by the consultant months later? Or are so many of these cases in people with other health problems and therefore not discharged.
An interesting comparator is the 2014/15 flu epidemic across Europe. Some summary detail here:
https://www.euromomo.eu/methods/pdf/winter_season_summary_2015.pdf
We are still a very long way from the 217,000 excess deaths in the monitored countries from that season.
That’s 888 deaths per million population. For Covid 19 San Marino is on 943, Spain 266, Italy 254, Andorra 233, Belgium 125, France 116, Netherlands 103, Switzerland 79, UK 73, Luxembourg 50, Sweden 40, Denmark 31, Portugal 29, Ireland 28, and on down to single figures for the likes of Finland and Estonia.
The ONS figures are released on Tuesday, The next release from ONS on April 7th will be for week 13, that is week ending 27th March.
ONS record death registrations by date of registration so are about 11 days behind the PHE figures of covid-19 deaths, but will include all deaths whereas the PHE figures are only hospital deaths.
I am curious. Why do deaths go down over Christmas. Is it lack of reporting.
“Is it lack of reporting.”
There is a famous warning story familiar to students of statistics, about the researcher who examined birth records and produced an astonishingly strong correlation between birthrates and the weather. Relatively few babies were born on rainy days.
Then the researcher realized he was looking at the dates on which someone went to the government office to register the birth, not the actual date of birth.
“Then the researcher realized he was looking at the dates on which someone went to the government office to register the birth, not the actual date of birth.”
This is one of the first things to look at when you have the data showing something, what is it actually showing?
I strongly suspect the exponential graphs of c19 results are nothing more than showing the rate of increased testing. When this is done and dusted, there will be some ugly truth behind all the data being used to direct policy.
Well said Gavin, agree completely. Although I think DP fatalities (sadly, the best control we have) has gone up by 1 death to 11.
Yes. The ONS provisional weekly figures are by date of registration not of death. When the registry office is closed then a death cannot be registered. And holidays also tend to close every other office, so less urgency for the bereaved and executors to obtain that all-important death certificate. Note how with every bank holiday the weekly rate tips up a bit the week before and after. Die on a Thursday before the holiday and there is an incentive to register it on Friday rather than delay until Tuesday.
Yes Gavin, I totally agree with your comments. It seems it is perfectly acceptable for 28,000 people to die in a Flu season (as they did 2014/15) – just as long as they don’t embarrass the NHS.
Since the vast majority of the population have no idea how many die of Influenza Like Illnesses (ILI) every year (average 17,000 a year over the 5 years to 2019) they can be frightened by the hysteria of C-19. It is a very nasty ILI, but thankfully doesn’t seem to kill as many children as the Flu often does.
It is difficult to see how this course of ruining the world economy, never-mind ours, can be justified by the data. As you say, only by forecast models that are unproven.
Also herd immunity should perhaps have been a better route – especially as there is NO effective vaccine for H1N1 more than 10 years on.
In the spirit of full disclosure – I am 74, although thankfully fairly healthy. I resent having my children and grandchildren’s future ruined on my account.
Whilst most countries are surging ahead with recovery rates, the UK hasn’t seen any since Mar 23. The low figure of 135 recoveries, and 12107 deaths from a total number of 93873 cases, is embarrassing to say the least.
The government are so embarrassed by their failure that they no longer publish the recovery figure in Worldometer.
The UK will fair far worse than any other country in Europe, with COVID-19, and I knew it would from the onset. The reasons are given below:-
High density population, so disease spreads far more easily.
Overstretched and underfunded health service who can’t cope.
A wholly incompetent government who havn’t prepared for it.
Comments are closed.