A reader of this blog, Christopher Bowyer, sent me some more interesting graphs. First of all we have the age breakdown on Covid-19 deaths by age (click to enlarge):
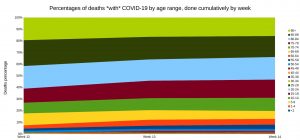
Of course we have to be careful to note that the Covid-19 category includes anyone who dies with Covid-19, not necessarily of Covid-19, so no doubt some of these deaths aren’t really caused by Covid-19, so we can’t take them too literally. Nevertheless, they show that the lower down the age ranges you go, the less risk there is from Covid-19. The younger you are, the less risk there is.
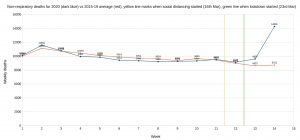
Non-respiratory deaths for 2020 vs 2015-19 average (click to enlarge):
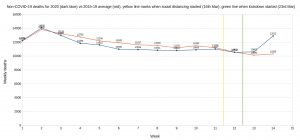
Non-Covid-19 deaths for 2020 versus the five-year average (click to enlarge):
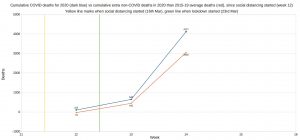
This next graph has cumulative Covid-19 deaths in blue. In orange we have the extra non-Covid-19 deaths in 2020; extra, that is, compared with the five-year average. Both lines start at week 12. (Click to enlarge)
(All graphs based on ONS stats. Christopher has also sent me some graphs based on NHS data which I will put up soon.)
17 thoughts on “More week 14 Covid-19 graphs”
many thanks. really appreciate all of this.
You are stating “facts” with too much confidence, oh blogger. Thus:
‘the Covid-19 category includes anyone who dies with Covid-19, not necessarily of Covid-19′
I’ll bet my bottom dollar it doesn’t contain “anyone who …’ in the sense of everyone who. I dare say it contains many of those who die of or with the virus. Perhaps it contains everyone reported to have died of or with the virus But that ain’t the same thing.
You are already doing more than your share; would anyone else like to have a go at blogging on the subject of how many – meaning probably how few – things we know with high confidence about this virus and its plague?
I suspect we all have high confidence that it picks on the old and the frail, and especially on those who are both old and frail. What else?
I note the BBC headline at the moment is ‘Deaths reach 20 year high’. On the basis that the last time we had 18.5k deaths in a week was January 2000, during a flu epidemic. Its odd, I don’t member the economy being closed down and people confined to their homes then, but it must have happened right???
Apart from which the 18.5k deaths just announced undoubtedly contain some people who have died as a direct consequence of the lockdown rather then CV-19, so its not even as bad as back in 2000 anyway. Thats without even going back into the 90s when there were 2 more very bad flu winters in fairly quick succession. And of course the population was probably 4-5m less in 2000 than today, so in % terms that sort of death rate was higher.
@Jim – you may be right, but if you are, it’s not because you’re able to draw the conclusions you have from the data in front of us.
You can’t look at the numbers after a huge, suppressing, intervention and then say, “oh, they’re not that high, we needn’t have bothered with the suppression”. The data have already been altered by the act of suppressing the contagion.
Dave
Yes.
But the bit that is missing – the bit needed to put all of this in proper context so it can reasonably be decided what to do next – is “how many people have or have had the malady?”
If 90% have had it, then we know that having the malady isn’t a problem for the future; crudely, those whom it will kill have been killed and the rest don’t have any problem with it.
This has to be modulated by “but if you’ve had it once, are you immune, or immune enough, or badly weakened for a successive attack?”. And we don’t know that.
We also don’t know how many have had it.
In the absence of this data, it seems remarkably difficult to come to any reliable conclusion as to what “we” should do.
So where are the mass testings for “having had it or have it”?
Mass means so many people tested that IF the case fatality rate is notably below 1%, we get robust statistical results.
Is this happening?
Do you mean that the Covid-19 category doesn’t include everyone who has died of Covid-19? I’ve already stated that I think that’s the case on other blog posts. But seeing as care homes are the main place where there are likely to be unreported Covid-19 cases, I think we can still continue to say that it’s likely that it’s most vulnerable elderly people who are at risk. Figures from other countries confirm that too.
I am happy to put up guest posts from anyone who does some decent research and can write clearly, I’ve been thinking about doing that anyway. (But I can’t guarantee I’ll say yes. Welcome to the writer’s world.)
We have studies from the cruise ship, Iceland, Santa Clara county and no doubt several more indicating the fatality rate is on the low side.
My questions are:
1) to what extent can these studies be applied to the UK case?
2) if they can, do we now have enough data to make decisions? If we don’t have enough data, how much more do we need?
“So where are the mass testings for “having had it or have it”?”
Struggling to get to the required rates and levels of accuracy, particularly if you want to use a ‘had it’ (i.e. antibody) test to tell people they’re safe from (re)infection as a result of a large-scale screening programme.
What combination of “genuinely difficult” and “government incompetence” you ascribe to this is a matter of taste, though many countries have had problems with buying tests that they’ve later decided aren’t good enough; it’s not purely a UK problem.
As to your main point, that almost nothing is known in enough detail to be certain about anything, I definitely agree. The people who seem to most confidently assert that we’ve either over-reacted or under-reacted are jumping the gun.
It may be worth adjusting the deaths by age for the relative size of the population cohorts, perhaps looking at the male element and the female element as the two extremes for each cohort. Data for that available here:
https://www.ons.gov.uk/file?uri=%2fpeoplepopulationandcommunity%2fpopulationandmigration%2fpopulationprojections%2fdatasets%2flocalauthoritiesinenglandtable2%2f2018based/table2.xls
It would make the age factor even more evident.
I’m not sure about the Santa Clara study, the criticisms seem pretty fatal (given the low number of positives, they’re potentially within the positive error margin of the test). That said, the aircraft carriers, cruise ship and Iceland all point one way, as do the tests in Scotland, Denmark, Germany, Sweden and Finland.
That’s a typical BBC dodgy headline. The deaths for a given week may have reached a 20 year high, but deaths for year-to-date may well be lower than average. And the lockdown is resulting in unnecessary deaths as well as possibly saving lives. Also, why did they pick 20 years and not go back to the start of the postwar period?
It’s about time the media stopped reporting statistics unless they can put them into proper context instead of making it headline grabbing.
They quote someone from the ONS:
“He said it could be that people with other illnesses were avoiding going to hospital for treatment – visits to A&E have halved since the pandemic started – or an under-reporting of coronavirus.”
I can assert with confidence that some people will have died from other illnesses because they didn’t go to hospital, for whatever reason they didn’t go. The only thing in doubt at this stage is the exact numbers.
@Dave: you can if you think that the lockdown has done b*gger all to suppress the infection rate, not least because I reckon it had been floating around the UK for far longer than the point at which the authorities suddenly became aware of it. The speed with which cases suddenly popped up all over the UK immediately after the first one was found suggests that it wasn’t so much the first case but the first case we knew about.
Apart from that you have the counter point of Sweden which has no lock down but appears to have less infections per 100k population than the UK. So there is no actual evidence that lockdowns make a ha’pporth of difference, its the characteristics of the population in question that determines what the infection and deaths rates will be.
“Also, why did they pick 20 years and not go back to the start of the postwar period?”
Because if they did they’d find plenty of times when a huge number more than 18.5k people died in a week. I bet at the peak of the Hong Kong Flu epidemic in 68/69 it was far worse than that. The point is ‘worst in 20 years’ is as bad as they can paint it. Which is nothing, unless you’re a idiot who can’t see further back than last Tuesday and everything is always ‘unprecedented’. We’re being treated in a way that has never been done before in this country, at vast cost to everyone and I expect a bit more of a crisis than ‘the worst weekly death rate in 20 years’ to justify what they are doing.
Tom,
Could you link to the best of the critical responses to Santa Clara.
Thanks
I just read all of the BBC article and they do compare YTD figures, but to the 5 year average (this year is a bit higher) rather than 20 year average. It would also have been useful to see the figures for the worst YTD in the last 20 years.
It looks like the Beeb is more interested in a story than really educating the public about death statistics and relative risk of Coronavirus.
Slowly getting better at this. Here’s Wales infection rates – with mouseover for underlying data
https://datawrapper.dwcdn.net/7Lbsv/1/
It really picks out the conurbation concentration in what used to be steel making country.
A revised version of England (same data, better presentation):
https://datawrapper.dwcdn.net/OvtCA/2/
Comments are closed.