
This is an article by Prof Robert Watson.
This article critiques the analysis of Warwick University researchers Andrew Oswald and Nattavudh Powdthavee. Their research (henceforth, O&P) received a large amount of publicity recently (with articles in the Daily Mail and Telegraph). Moreover, a ‘Policy Briefing paper‘, a separate press release, and the research paper itself, which goes under the hyperbolic title ‘Age, Death Risk, and the Design of an Exit Strategy: A Guide for Policymakers and for Citizens Who Want to Stay Alive‘ were all displayed prominently on the University of Warwick website.
O&P claim that because the case fatality rate for 20-24 year olds is only 1/30th that of 50-year-olds, this justifies their so-called ‘practical solution’ to ending the lockdown. ‘Practical’ seems to have a very different meaning to academics such as these. Their Maoist ‘cultural revolutionary’ solution is locking down the over-50’s more-or-less permanently whilst allowing those in their 20s (and perhaps later allowing those in their 30s and 40s) to take over the running of other people’s businesses. O&P even call for government propaganda focusing on their silly metrics: ‘Even if politicians do not want to follow our idea of a sequential release of younger-to-older cohorts, they ought to explain to the public the risks associated with being older. Death-risk graphs of the kind given later in the paper should also be made clear in government briefings and on television. The information would help citizens to make their own choices about what to do and what not to do.’ (O&P, p. 3, emphasis in the original)
I won’t be critiquing their so-called ‘practical solution to ending the lockdown’ as it is clearly quite mad, and not a little Orwellian (or should that be now ‘Oswaldian’), given that they advocate putting under house arrest all people over fifty irrespective of health status, whilst simultaneously effectively expropriating their businesses all in order to supposedly save them from the risk of dying from Covid-19!
I’m sure that there will be plenty of commentators itching to educate them on the impracticalities, human rights and economically-disastrous consequences of such an attempted course of action. Rather in this post I will concentrate on replicating O&P’s research and then showing why:
– their ‘case fatality rate’ metric makes no sense given the unequal size of the age cohorts;
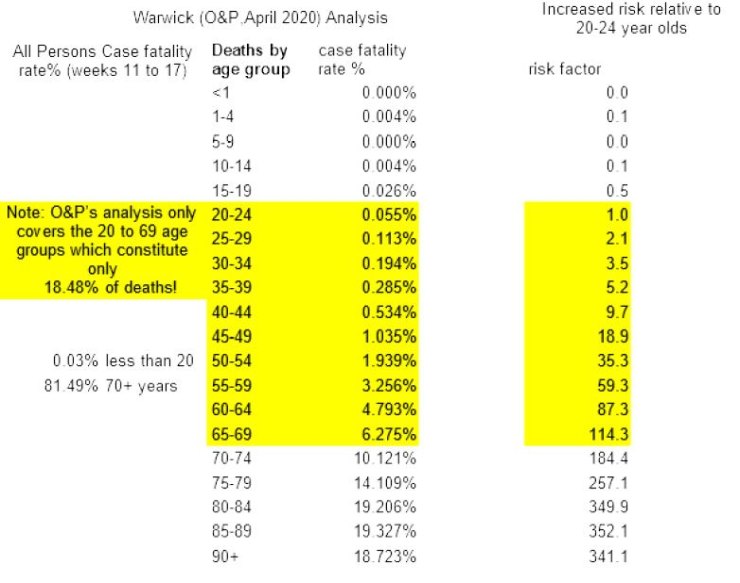
– their resulting ‘relative risk factors’, based upon the case fatality rate of the relevant age cohort divided by the case fatality rate of the 20-24 age cohort, produce misleadingly scary numbers. For example, their figures for the relative risk factors for the 50-54 and 65-69 age groups are 32.6 and 110.1 times that of the 20-24 age cohort respectively. However, these seemingly large numbers are generated by using a very small denominator (the case fatality rate of 20-24 year olds is only circa 0.05%).
– their concentration on the age range 20 to 69 years old only covers around 18% of total Covid-19 deaths, as over 80% of Covid-19 deaths occur within the >= 70 age cohorts. I show that because their case fatality rate does not take account of the differing sizes of the individual age cohorts (e.g., the 90+ age cohort only consists of 554,000 individuals whilst the 20-24 age cohort is some 3,663,000 strong), the resulting relative risk multiple for the 90+ cohort is actually lower than for the 85-89 cohort. O&P don’t show this on their graph because it would reveal the limitations of their case fatality rate metric and, of course, the relative risk factors derived from it.
Figure Three of O&P provides the basis of their analysis and public policy recommendations. This is reproduced below.
FIGURE 3: AGE-GROUP RISK ESTIMATES FROM COVID USING UK DATA Case fatality rate (%) = Number of deaths by COVID-19 in that age-group/Total number of all deaths by COVID-19: England and Wales as of 10th April 2020. Age is on the horizontal axis. Log risk scale on the vertical axis.
[HD: In case the Y-axis is hard to read, it says ‘Relative case fatality risk (baseline = age 20-24).]
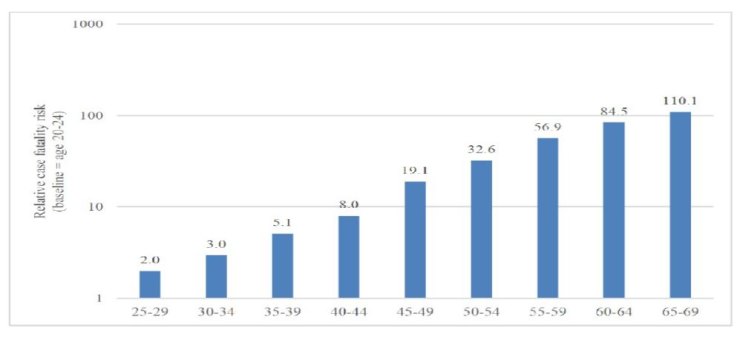
Notes: Total number of deaths by COVID-19 as of 17th April 2020 = 13,121*. Here the vertical axis is necessarily constructed in a different way from that used in Figure 1. These vertical bars depict relative risks. Here they are measured relative to the age-group 20-24 which is set to 1.0.
Source:
https://www.ons.gov.uk/peoplepopulationandcommunity/birthsdeathsandmarriages/deaths/datasets/
weeklyprovisionalfiguresondeathsregisteredinenglandandwales
* RW: There’s a bit of an inconsistency here. Is it up to the 10th April or the 17th April? Also, I’ve checked the figures for total Covid-19 deaths to date for the 10th and 17th April and neither come to 13,121! For 10th April I get 10,335 Covid-19 attributed deaths (and only 8 cases in the 20-24 age group) and for the 17th April, I get 19,093 Covid-19 attributed deaths (and 10 cases in the 20-24 age group).
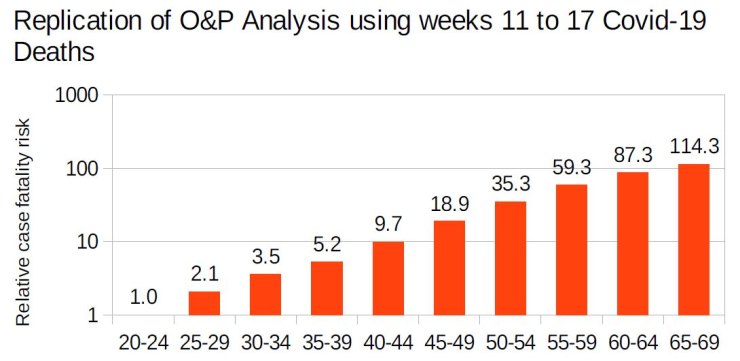
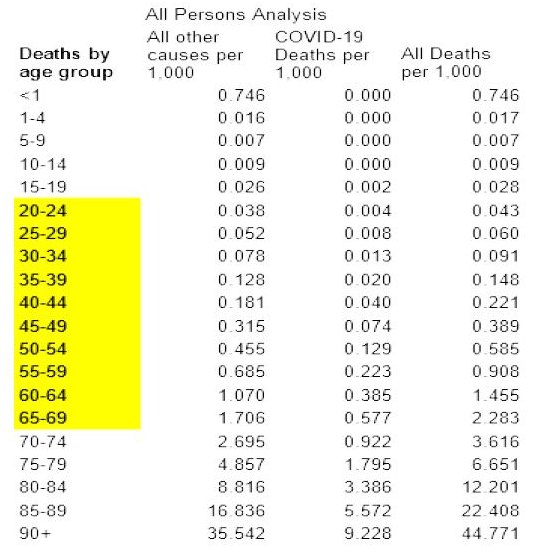
Nevertheless, although O&P do not provide their case fatality rates, my replication of O&P’s analysis for the weeks 11 to 17 Covid-19 deaths and my resulting relative risk factors are pretty close to what O&P present (the yellow portion of the table below).
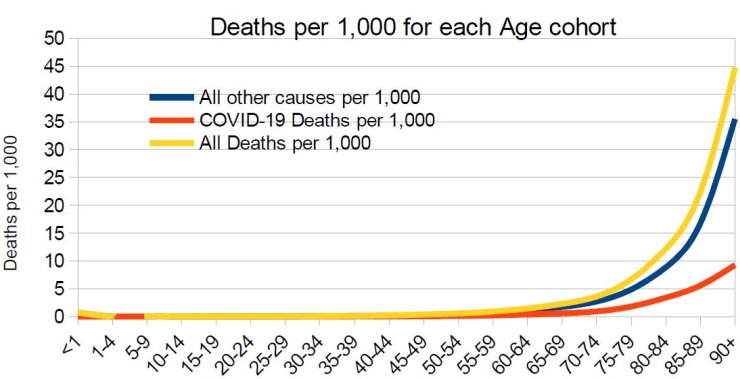
And below is my replication of O&P’s analysis in graphical form.
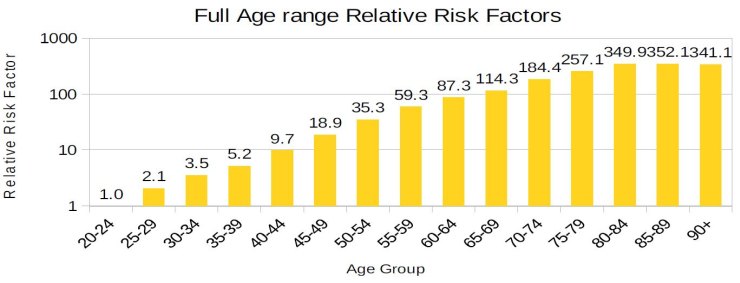
Note that if O&P’s relative risk factors are to be the only criterion by which to judge the ‘safety’ of easing the lockdown regime, then their own figures show that only the 10-14 age cohort can safely be let out as they have a relative risk factor that is only approximately 1/10 of that of the 20-24 age cohort! Also, it is worth noting that the 20 to 69 age range employed by O&P actually excludes more than 80% of all Covid-19 attributed deaths. Once the Covid-19 deaths for the higher age groups are included in the bar chart, it is obvious that O&P’s relative case fatality factors go awry somewhat. The relative risk factor for the over 90’s is less (341.1) than for the 85-89 year olds (352.1)! For those convinced by O&P’s relative risk factors, then I have a beach front property in Madrid that I’d like to interest you in.
Quite apart from the serious question marks regarding the meaningfulness of their metrics and the arbitrariness of choosing the 20-24 age cohort as the basis for the production of the apparently scary multiples, perhaps the most serious limitation of O&P’s analysis is in fact the complete lack of a benchmark against which to judge the deadliness or otherwise of Covid-19 relative to how deadly normal life is and the magnitude of normal death rates from all other causes. This is easily overcome by calculating the actual death rates per 1,000 of each age cohort. Note, unlike the relative risk multiples used by O&P, this method shows clearly that All Other Causes Of Deaths Per 1,000 + Covid-19 Deaths Per 1,000 = Total Deaths From All Causes Per 1,000.
Update: Quite a few submissions have come in recently, thanks. Hoping to finish working through them all today (Monday).
14 thoughts on “Robert Watson: Analysis of Warwick Uni Researchers’ Statistical Justification for Locking Down the Over-50’s Indefinitely”
O&P are looking at the wrong risks. The real question is what is the risk of each age group dying from Covid-19 ( little more than flu?), and what is the increased risk of dying from Covid-19 compared to the existing hazard figure.
I’m of the opinion that it should be up to individuals to choose what risk they accept, and as someone in their 50s I want to get back to normal now, not at some distant point in the future. In many quarters Covid-19 is being blown out of perspective as though it’s on a par with the back death. Gawd help our society if we ever have a really serious pandemic to deal with, because we’ve massively damaged our country just for this which could have been managed better.
Well said Dene. I totally agree!
Robert, thanks for your report. The government has acted on some very dodgy statistical analyses. Hopefully they are ignoring this one. I do wonder how such academics get to be taken seriously by their institutions.
“Man is born ignorant, it takes 4 years in College (Uni) to become stupid.”
Mark Twain
and he has been dead more than a century.
Well on the upside – Boris would be in permanent lockdown.
Perhaps that is why they chose 50???
Is there any examination of the legality of this scheme? What right do they have to deprive the innocent of their liberty on the grounds of age? It’s unlawful, or why do have even the delusion that there are human rights?
(Yes, what we have now is possibly unlawful too. Just because they can get a bill through doesn’t mean they are constitutionally allowed to put anything they like in it.)
Even current “laws” are almost certainly a breach of human rights laws and conventions.
Any restricts on freedom of religion, private family life etc etc have to be proportionate.
Excellent article. Another thing, at the risk of stating the obvious is that these figures are purely *statistical*. It doesn’t follow that an *actual* 20-24 year old infected by the virus has a 1 in 2000 chance of dying from it. Bertrand Russell and Winston Churchill are examples of life-long smokers who lived into their 90s. That doesn’t contradict the statistics on smoking shortening lifespan. It does show that smoking can’t of itself be a cause of death, absent some latent predisposition. Similarly those who perish from CV-19, to the extent that their immune systems failed to withstand the virus, were already poorly. And yet children going round in masks in fear of deadly contagion. But humans like other mammals are first and foremost mimetic. If you see other members of the group running in fear from something your best bet is to join them. You can’t *blame* people for that anymore than you can blame a man for his failure to solve quadratic equations or to translate Greek. You *can* blame their leaders, the ones who are able to translate Greek etc.
Daily Mail is the law in England.
Must you use “critique” as a verb? Really, must you?
They are basically pleading to get their students back into their clutches for indoctrination while giving no platform to other views. Gramscian Marxists.
@rhoda klapp Monday 11th May 2020 at 11:33
it appears as a verb in my 1972 edition of “The Shorter Oxford English Dictionary”
In view of his age Andrew could set the example by locking himself up.
Surely when O&P say “case fatility rate” they actually mean “age fatility rate”? To my simple mind case fatility rate is number of deaths/number of infections.
Comments are closed.