Here’s the Covid-19 disaster in Germany in the all-cause death figures. (Destatis’s own graph). Can you see it? It’s the red line.

Looks pretty flat and normal, you say? No, not at all, it’s just, er… resting. Yeah, resting. Tired and shagged out after a long squawk, I expect. Really it’s a monstrous mountain, it’s just having a kip now.
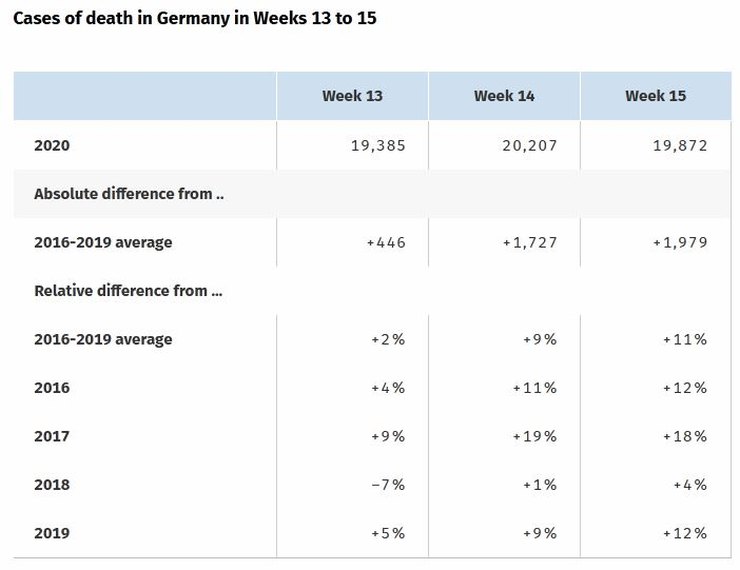
Okay, here’s an easier way to see the full horror.

Week 13 was, er, -7% compared to 2018. But week 14, that was a slaughter. A whole 1% above the 2018 figures. My God. And week 15 will send shivers down your spine: 4% above 2018. Hollywood movie stuff.
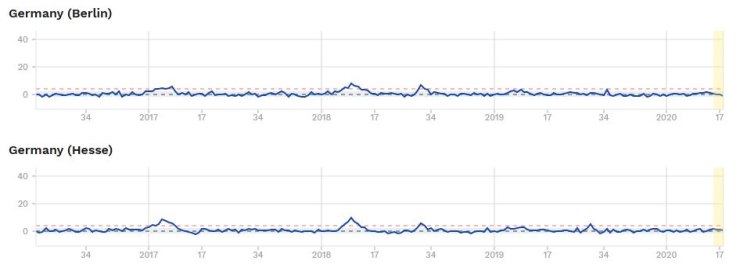
Euromomo also has Germany as flat as a tack:

There must be bodies piled up in the streets in old Munchen.
4 thoughts on “The German hidden disaster that’s extremely well hidden”
It’s probably the subsequent weeks which will be of interest, to Week 16 available 15th May. Allowing for population, no considerable difference to Week 13.
Week 13 D at least 19,385 , E+W 11,141
Week 14 D ,, 20,207 , E+W 16,387
Week 14 D ,, 19,827, E+W 18,576
I work in Germany. Here you pay through the nose for compulsory social care insurance (https://en.wikipedia.org/wiki/Long-term_care_insurance_in_Germany) throughout your working life, so the least they could do is keep the oldie-killing virus out of care homes. They seem to have largely succeeded, unlike Britain, Italy, Spain, France,…
Someone’s fibbing…
No surprise, it’s what I said is inevitable and same will happen here, probably a Rhino V spike too
Germany: Cases of Coronavirus Spike After Lockdown Restrictions Eased
Comments are closed.