Reader Christopher Bowyer has been busy again, and has sent me some more graphs, some based on NHS England data, and some on the ONS week 20 release.
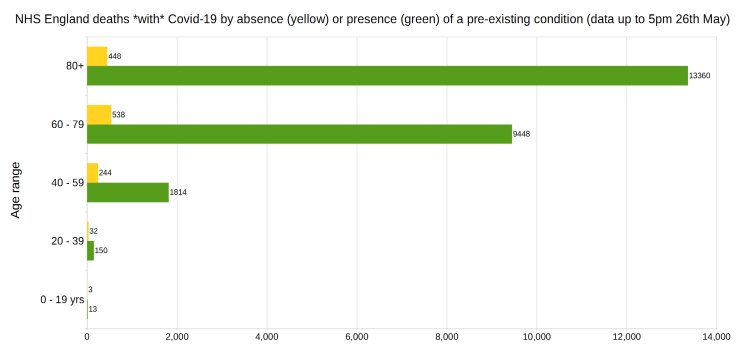
First, NHS England deaths with Covid-19 by absence (yellow) or presence (green) of a pre-existing condition.
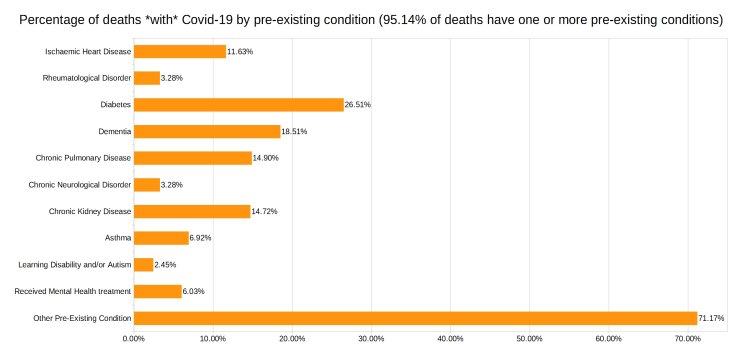
Next, percentage of deaths with Covid-19 by pre-existing condition. (94.8% have one or more P.E.C.) Data from NHS England.
Note that the most common pre-existing conditions are diabetes, followed by dementia, chronic pulmonary disease, and chronic kidney disease.
Covid-19 deaths in England by date of death, with 3-day moving average trendline (the thicker line). (Note that numbers in grey area will increase over the next few days.)
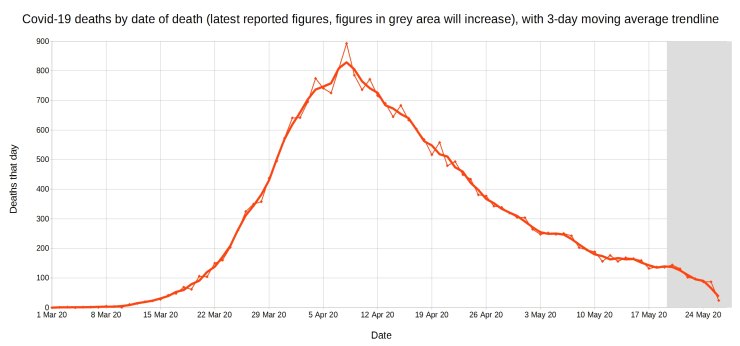
How is it not clear that the disease is dying out? According to Alistair Haimes, it’s no longer officially even an epidemic.
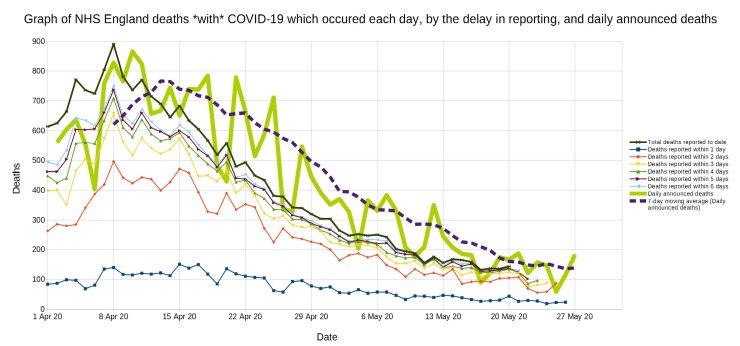
A graph of deaths with Covid-19 in England which occurred each day, by the delay in reporting. Thick line is overall daily announced deaths.
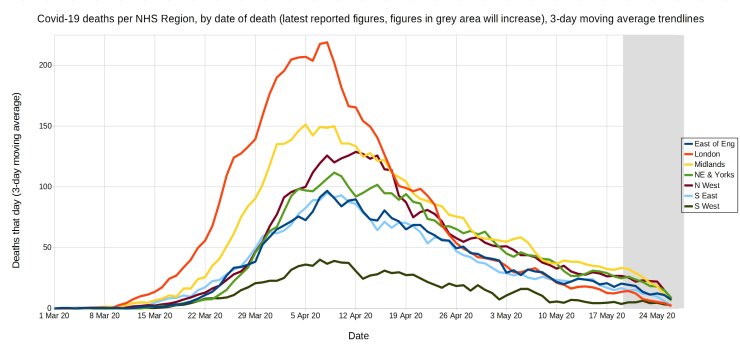
Trendlines (3-day average) for Covid-19 deaths by England NHS region, by date of death. (Note that the numbers in the grey area will increase over the next few days.)
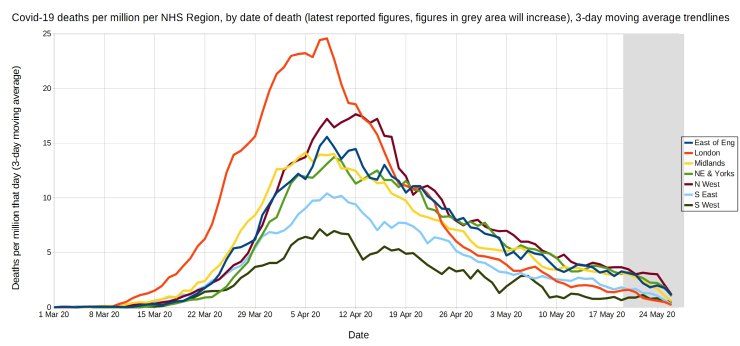
Trendlines (3-day average) for Covid-19 deaths per million by England NHS region, by date of death. (Note that the numbers in the grey area will increase over the next few days.)
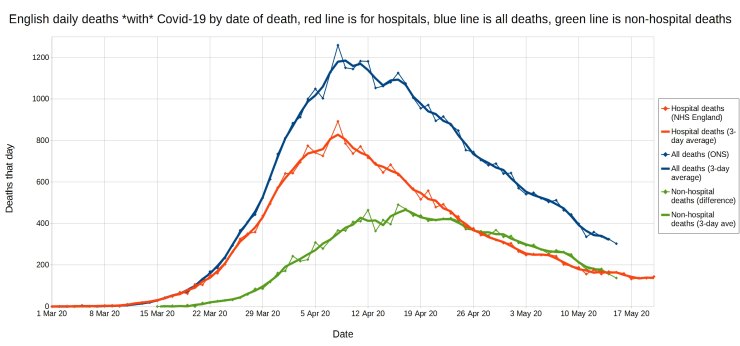
English daily deaths with Covid-19 by date of death. Blue line is all Covid deaths, red line is hospital Covid deaths, and green line is non-hospital Covid deaths.
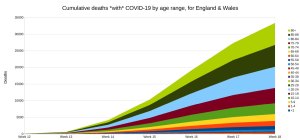
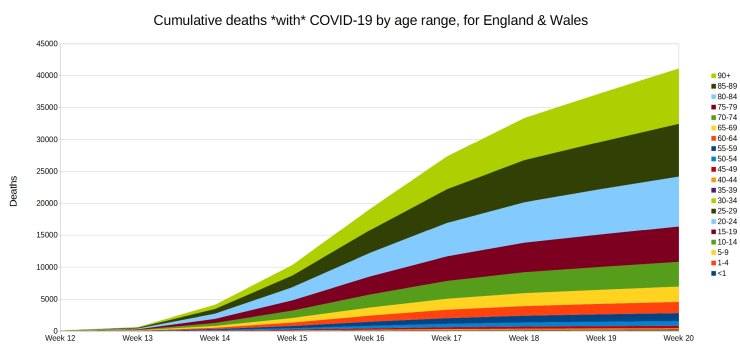
Weekly cumulative deaths with COVID-19, by age range (ONS data).
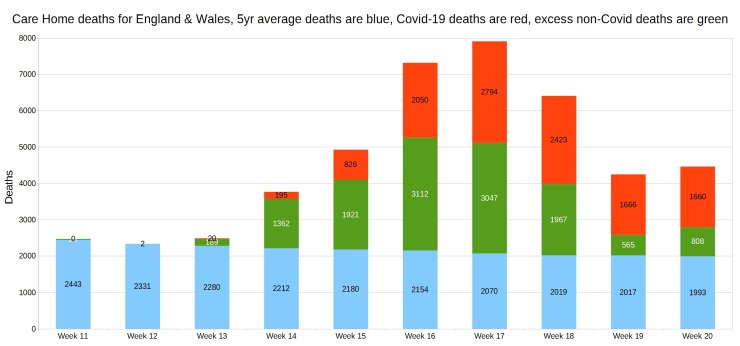
Care home deaths for England and Wales. Five-year average deaths are blue, Covid-19 deaths are red, and excess non-Covid deaths are green.
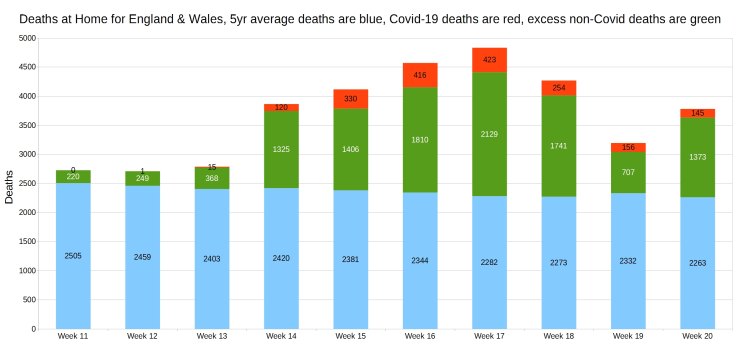
Weekly Covid and non-Covid deaths at home. Five-year average deaths are blue, Covid-19 deaths are red, and excess non-Covid deaths are green.
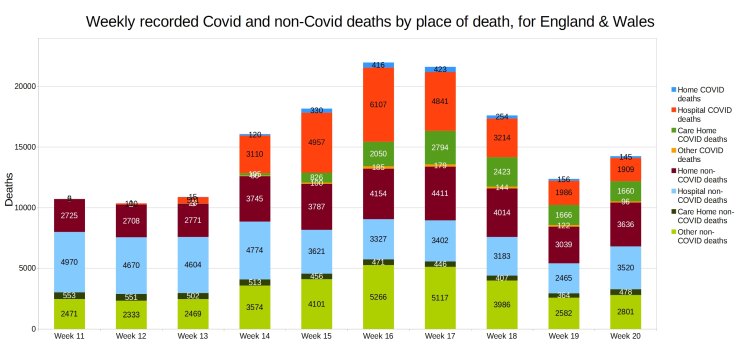
Weekly Covid and non-Covid deaths by place of death. ONS data.
Many thanks to Christopher for doing these once again.
Update: Please help out with donations or a Patreon sub if you can, or at least buy my book!
24 thoughts on “Late May graphs from Christopher Bowyer”
Thanks Christopher, I look forward to these graphs each week. They are always very telling
How on earth does Autism or having previously received treatment for mental health count as a PEC in the context of this virus?
I suspect that I may be mildly autistic and my wife has received therapy for depression and anxiety – are we more at risk? Of course not!
PS thanks Christopher for the excellent charts once again.
Great summary status graphs … thanks !! Keep doing them !
Thanks everyone – I’m glad you appreciate the graphs 🙂 Sorry I didn’t get round to sending last week’s graphs to Hector 🙁
Bloke in Kent, I’m not sure either why autism/mental health treatment count as a pre-existing condition, but NHS England list them on their weekly spreadsheet of Covid deaths & pre-existing conditions, so I put them in the graph with the other conditions.
Between Weeks 1 and 12, 138,916 deaths were registered, which was 4,822 less than the five-year average for these weeks. However, between Weeks 13 and 20, 135,575 deaths were registered, which was 53,960 more than the five-year average.
Thanks Christopher,
In my opinion, as I’ve said for months, it never was a pandemic or epidemic
Global CV19 Deaths are 0.003% of Global Population
A pandemic is an epidemic of disease that has spread across a large region, for instance multiple continents or worldwide, affecting a substantial number of people – 0.4% of population infected is not ‘substantial’, 0.003% dying is not ‘substantial’
NI still no excess deaths. A couple of weeks ago I suggested reason may be related to few non-whites
Decided to explore possibility. UK Demographics:
Seems I may be correct, anyone up for some more detailed investigation?
btw Glasgow has highest CV19 deaths in Scotland
thanks Pcar; “NI still no excess deaths. A couple of weeks ago I suggested reason may be related to few non-whites”
you could well be right for NI; Wales is 95.6% white;
they did have a brief and notable spike; but friends with knowledge had said that South Asian ethnicity was very much over-represented in the S Wales ICU admissions: we know T2 diabetes is 5-6times more common in S Asian populations; it seems the cluster of hypertension, diabetes, obesity and heart disease all featured very strongly in ICU admissions; heart disease is tightly tied into diabetes; this has been known since the 1920s.
Christopher’s data shows so well in the “pre-existing conditions” data, that if you are healthy, you will likely do just fine, whatever your age; does ONS have ethnic data, as well as all the other stuff?
Some ethnic data here, but only up April 10:
https://www.ons.gov.uk/peoplepopulationandcommunity/birthsdeathsandmarriages/deaths/datasets/countsandratiosofcoronavirusrelateddeathsbyethnicgroupenglandandwales
Shows that some ethnic groups have much higher death rates than whites. but in terms of actual numbers it’s overwhelmingly white deaths, so not sure ethnic differences will explain much.
Pre-existing. But were they known?
For example, did the bloke know he had diabetes before he was admitted for Covid?
Should people who don’t have pre-existing conditions feel safer, or does it mean nothing because they are going to find some conditions for you once you are in?
Do they ever split the diabetes between type 1 & 2? Given the increased risk with obesity, I suspect that many of the diabetics are type 2. I think there must also still be an increased risk with type 1 due to effects on immune system.
@HD
“Shows that some ethnic groups have much higher death rates than whites. but in terms of actual numbers it’s overwhelmingly white deaths, so not sure ethnic differences will explain much.”
Surely the rates ARE the most important figure? The number disparity is probably explained by the huge number of deaths being in Care Homes – we would need to look at the race makeup in these institutions, but if they are overwhelmingly white that would explain your actual numbers disparity.
Trying to characterise the disease in terms of human impact is difficult at this stage. Flu, for instance, is seen as an inconvenience for most people, but deadly to the old and frail because it is often associated with deadly pneumonia. We typically only worry if a flu bug gets into a care home, and take appropriate precautions. For other citizens, none are warranted.
How will we see Covid-19? Will it become ‘just another flu’? Looking at those rates, I suspect that when Covid comes around next winter, being Black or Chinese might be a reasonable excuse for working from home over the flu season…
I’m not so sure about the diabetes link. Approx 90% of diabetics are type 2, which is mainly brought on by obesity or (mainly) old age.
Approx 20% of the elderly have type 2 diabetes, rising to 25% amongst the care home population.
Given the demographic of people dying with CV-19 (i.e. the elderly), wouldn’t we expect to see a high rate of type 2 diabetes amongst this group anyway, whatever the cause of death?
I say this as a type 1 diabetic in the 20-39 age range. I’m not worried about this virus at all and am carrying on with my life as normally as possible.
@samuelbuca Sunday 31st May 2020 at 06:57, @BiK
Yes, but until last week not mentioned by msm. Type 1 has no higher risk. Type 2 usually also fatties
To add to yesterdays NI “whiteness”. I’d suggest about 50% of non white are orientals who also not at more risk
In NI early-mid 1960s almost every town and large village had a Chinese restaurant/take-away. Until I moved to GB in late 70s the only black/brown I’d seen were the occasional black soldier. Even here, the only non-whites at school/uni were orientals. Today a mate and I had a coffee & sat in sun outside Morrisons (no queue) – in 2 hours one-non-white; London is very different from rest of UK
Decided to see if close to correct:
Irish Travellers – do they class themselves as white? Non-white (green, white & yellow)?
In NI, we’re easy going – if you assimilate
NI Joke:
Hey Jimmy Yan, what religion are you
Budddist
But, are you a catholic or protestant Buddist?
To add to yesterdays NI “whiteness”. I’d suggest about 50% of non white are orientals who also not at more risk
In NI early-mid 1960s almost every town and large village had a Chinese restaurant/take-away. Until I moved to GB in late 70s the only black/brown I’d seen were the occasional black soldier. Even here, the only non-whites at school/uni were orientals. Today a mate and I had a coffee & sat in sun outside Morrisons (no queue) – in 2 hours one-non-white; London is very different from rest of UK
Decided to see if close to correct:
Irish Travellers – do they class themselves as white? Non-white (green, white & yellow)?
In NI, we’re easy going – if you assimilate
NI Joke:
Hey! Jimmy Yan, what religion are you
Budddist
But, are you a catholic or protestant Buddist?
A look at when new cases peaked across England:
https://datawrapper.dwcdn.net/ak5qX/1/
Mostly quite early on. Many of the areas where it was later had lower levels of infections that were more sporadic with peaks defined by care home or hospital outbreaks. Of course, infections probably precede these dates by a week to 10 days because they mostly relate to cases that became more serious and justified testing.
On ethnic data, I think that ONS remain behind the curve. They are relying on population estimates based on the 2011 census with some updating using the labour force survey data to give an estimate of the local populations in 2016. They are almost certainly missing significant numbers of new immigrants, both legal and illegal. Clearly care homes remain predominantly white, simply because there are few elderly ethnic minorities because immigration – dominated by those in their 20s and 30s – has been mainly post 1997. I found that the primary driver for cases is population density, with a mild power law relationship. Of course, ethnic minorities do tend to live at greater density in cities. But I found no obvious added ethnic factor looking at the points on this chart:
https://datawrapper.dwcdn.net/K3uOD/1/
Perhaps I should re-do it and see whether anything pops out now we’re more or less done.
The S Wales ICU is in an area where ethnicity data shows 89.9% white, so more in line with the Scotland/Glasgow situation. There have historically been issues with TB and pneumonia there, in part due to people coming or returning from stays in SE Asia, which likely doesn’t help
Fascinating charts and thanks for sharing, Christopher. I was particularly interested in the second one, which appears to represent an absolute slam-dunk in terms of discrediting the lockdown. However, please could you clarify why the total deaths accounted for in it only amount to just over 26,000, when the overall UK figure is around 40,000? Where have the other 14,000 or so gone?
To add to yesterdays NI “whiteness”. I’d suggest about 50% of non white are orientals who also not at more risk
In NI early-mid 1960s almost every town and large village had a Chinese restaurant/take-away. Until I moved to GB in late 70s the only black/brown I’d seen were the occasional black soldier. Even here, the only non-whites at school/uni were orientals. Today a mate and I had a coffee & sat in sun outside Morrisons (no queue) – in 2 hours one-non-white; London is very different from rest of UK
Decided to see if close to correct:
NI population 1.882 million
1.72% non white = 32,370
Irish Travellers – do they class themselves as white? Non-white (green, white & yellow)?
. Orientals ~14,000 = 42% of non whites
In NI, we’re easy going – if you assimilate
NI Joke:
Hey! Jimmy Yan, what religion are you
Buddhist
But, are you a catholic or protestant Buddhist?
@Hector
Post gone to spam bin same as yesterday. Please approve today’s rewritten post
Fixed Pcar. Sorry about that, your updates are always very welcome.
Also found a couple of other people’s comments that had gone to spam as well.
@Hector
Posts appeared today, did something go wrong?
Yes, on Monday I approved a few genuine comments in the spam folder and assumed they’d been posted, but then noticed more recently that they were now all in some folder called ‘Pending’, so I had to further ‘approve’ them.
Comments are closed.