
For quite a while I’ve been trying to find the US all-cause death stats for the recent years, but I always assumed that before too long someone more knowledgeable about the US figures would get them and make a graph. But if anyone did, I never saw it.
The CDC website is pretty awful, and unorganised, and it leads you around in circles, but eventually I found them on this page about the flu. Not on the page itself, but if you click on Download (and choose between a few options when they come up), you get a file with various information, including flu and respiratory deaths, but also the all-cause deaths figures back to 2015. (I found that if you opened the file directly into Excel, it didn’t load in any sort of useful way, but if you save the file first and then download it, it works.)
I then had to add up the totals for weeks 1-19 for the last six years. (There is data for weeks 20 and 21 for 2020, but this is incomplete, so I only went up to week 19, which is up to 8 May).
So I’ve made a bar graph out of this data.
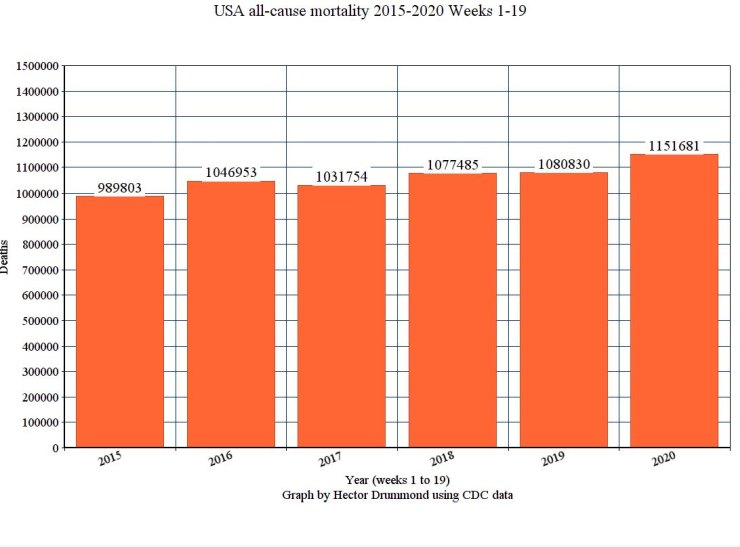
Can you see a once-in-a-century disaster here? Or did the various lockdowns amazingly save millions of lives? (They sure were amazing, those lockdowns, weren’t they?)
2020is so far only 10% above the five-year average (which is 1 045 365).
Bear in mind as well that some of these 2020 deaths will be lockdown deaths, rather than Covid-19 deaths.
I’ve also downloaded US state data, which I’ve working through to get the New York City and New York State data from, which has been the worst-hit area in the US.
23 thoughts on “USA all-cause mortality 2015-2020 weeks 1-19”
It’s not even that stark.
The all-cause mortality from your chart is 16 percent up from 2015. The total population has increased 3 percent. The over 65s have increased 15 percent. The difference is next to nothing.
Rodney Hide
I believe that the 1968 ‘Hong Kong flu’ (H3N2) killed similar amounts of people. We should really be comparing the improvements in addressing respiratory epidemics over the last century .. if any…
Is it possible from the data to arrive at an all-cause mortality for the flu seasons covering mid-winters and compare this to the covid weeks? It would give a fair picture of comparative effect.
https://www.patreon.com/posts/35004617
Article on the Japanese health posters from the 1918 Spanish Flu, other than the artwork one interesting element is that the advice being given to the public hasn’t really changed much in 100 years.
What struck me was the smooth increase in deaths every year – immigration adding to population I assume
2017 to 2018 – 4% higher
2019 to 2020 – 7% higher
A thought – when an illegal immigrant dies I assume they’re added to recorded deaths. This distorts deaths/million population
In UK illegals increase stated population by ~10%. Estimate is ~1.5million illegals in London alone
The US population has increased by approx 0.5% annually for the past decade. So why would you “assume” that a 4% annual increase – or, indeed, a 7% one – might be explained by “immigration adding to population”? If the size of the US population had increased by 21 million in a single year, that really would be news. Just as it would be if there were 6.5 million “illegals” in the UK (or 1.5 million in London), when even the Telegraph has the upper figure at 1.2 million!
Good work. This is why questioning the collective ‘wisdom’ of experts, MSM, Gov’s and especially SM is so revealing. Looking at large populations for a worldwide pandemic, which is what the WHO and others declared, is the only true way of assessing impact. Globally this virus will be a scratch, the serious wound will be caused by the irrational response and it will fester for years.
@O Please
The deaths increase this year is high, as it was 17 to 18 followed by small increase 18 to 19. Pandemic – No
– 2017 to 2018 – 4% increase
– 2019 to 2020 – 7% increase
USA deaths in chart show increase by more than 0.5% annually – is life expectancy falling?
2014: California was home to between 2.35 and 2.6 million illegal immigrants making up >6% of the state’s overall population of 39.5million
UK supermarket food sales suggest UK pop is ~10million more than official pop
Thames Water sewage volumes suggested 1 million illegals in London 5-10 years ago
There is a HUGE factor omitted from all of these “excessive death” numbers which is the way that the “excessive death” numbers have been trending over the last decade in the US.
This year is decidedly NOT an aberration.
For the US, the Macrotrends site below estimates 8.88 deaths per 1,000 residents for 2020, which would be about 3 million deaths of all causes for Jan. 1 to Dec. 31 of this year. The chances of the “Coronavirus epidemic” pushing that figure noticeably up, in a way such that someone at a distant time or place glancing at a table of deaths for a long period would immediately notice, appears to now be zero. Though I am sure most people will still vaguely think it is a major threat of exactly that kind, owing to the pro-Panic side’s control of the media narrative.
On total deaths in the 2010’s in the US.
The low-period for deaths per capita in the US was 2008 to 2013 (rate: 8.12 to 8.16 range). Looking at deaths since then (2013 to 2019):
US Deaths per 1000 residents:
– 2013: 8.159
– 2014: 8.264
– 2015: 8.369
– 2016: 8.475
– 2017: 8.580
– 2018: 8.685
– 2019: 8.782
– 2020: (proj.) 8.880
US Census estimates for total resident population as of July 1 of each year (Census Table NST-EST 2019-01):
– 2013: 315,993,715
– 2014: 318,301,008
– 2015: 320,635,163
– 2016: 322,941,311
– 2017: 324,985,539
– 2018: 326,687,501
– 2019: 328,239,523
– 2020: 329,877,505
Multiplying the two we get an interesting result.
TOTAL DEATHS in the US:
– 2013 total deaths: 2,578,000
– 2014 total deaths: 2,630,500
– 2015 total deaths: 2,683,500
– 2016 total deaths: 2,737,000
– 2017 total deaths: 2,788,500
– 2018 total deaths: 2,837,000
– 2019 total deaths: 2,882,500
– 2020 total deaths (proj.): 2,929,500
Notice the substantial increase each year, absent any named, attention-getting, Panic-creating flu-virus event through the 2010s (some bad flu-strains existed but no one noticed/cared). 2019 had +146,000 more total deaths than 2016, for example, and even +304,500 (!) over 2013.
2020 was projected to have even more, +351,000 deaths over 2013, an estimate made before anyone knew about Coronavirus.
The basic mechanisms for these big-looking increases is no mystery, and nothing to panic about (of course):
Aging population plus higher base population. Plus, some on the margins is due to the well-documented rise in so-called deaths of despair in Middle America, which includes drug-deaths; this part of the increase we SHOULD worry about, as certainly it is much more harmful than the current flu-virus pandemic, by any half-way objective measure. But about the rise of deaths of despair we hardly hear at all. No emergency measures, no martial law, hardly even any attention. Why?
Needless to say, the observed increase in deaths since 2013 far more than covers (exceeds) the total of number of deaths attributable to the 2020 coronavirus. The CoronaPanic-pushers of 2020 either don’t know or don’t care about this. It qualifies as “Context,” which is a heresy to Corona True Believers.
U.S. Death Rate 1950-2020:
https://www.macrotrends.net/countries/USA/united-states/death-rate
Only 2.6 million illegals in Soviet Kalifornistan? I call shenanigans, good sir. It’s ten million at least, if not fifteen. Come to Los Angeles or San Diego and take a long hard look around you on the street.
The population of the US is at least 20% illegal aliens, and another two to three million cross the southern border each year.
Between 500,000 and 1 million illegals enter the US each year on commercial aircraft. Those numbers are verifiable.
I recently saw a death-rate-from-all-causes-in-the-us-between 1950 and 2020. It showed that since 1950, we had a gradually series of downward step formations until 2000. Then the rate flatlined until Obama took office. From that time, coinciding with the rollout of home smart meters, a 45 degree upward incline in the overall deathrate occurred and has not abated. The question is this: what other variables are involved in such a steady-state increase in overall death rate (aging boomers, importation of immigrants, increased use of cell phones and screens in general since 2000, changes in vaccines, etc. Once could even argue that the attempt at a single-payer health care system contributed, because that also coincided with the Obama era – I know a few people who could not longer afford insurance after he “fixed” it, so they went without.
We have to consider not only the population increase, but the mix. We are at a point where the average Baby Boomer is in their late 60’s this bulge at the upper end of the scale will definitely increase the death rates.
Most important!! Can we get an update to end Sept?? that would be more relevant!
Thanks!
Thanks for this. I like you have been trying to piece together annual death rates for USA. I found them nicely listed for Canada, where I live. macrotrends.net is the closest I came to what I wanted/needed. Macrotrends graph shows no difference of percentage increase of deaths from 2019 to 2020. I just want people to ‘panic’ less. Some good data from others commenting as well. thanks again.
Thank you for TRUTH!
Hector,
I agree the data is hard to come by. You state that your best data comparing 2019 data vs 2020 USA death data is from megatrends.
When I looked at megatrends there was a large disclaimer that 2020 data were projections not measurements and specifically did not include COVID 19 deaths.
https://www.macrotrends.net/countries/USA/united-states/death-rate
Were you looking at a different data set?
Respectfully,
Robert Russell, MD
Could someone please clarify the matter of ‘recording period’
Some claim that the reporting period for 2020 started on the 1st February 2020 and implied that January 2020 deaths still need to be added to the CDC numbers to get the total for the year.
If applied consistently from one year to the next this would not be a problen of course!
So were the 2019 deaths for the period 1st February 2018 to 31 January 2020%
Would appreciate your thoughts!
That did not age well.
This analysis based on a CDC web page about flu is not needed. Here is the CDC page directly addressing the subject. The excess deaths are much greater than this article describes.
https://www.cdc.gov/nchs/nvss/vsrr/covid19/excess_deaths.htm
I just downloaded the data from the flu view website he noted to do the math myself. Even in this data it is a little confusing because they use seasonal years as opposed to calendar years. This is what my calculations show from the data going by calendar years.
2017 – 2,800,784 Total Deaths
2018 – 2,831,836
2019 – 2,845,793
2020 – 3,248,240
So this does seem to show a large bump in total deaths. I can’t verify if CDC data has been changed since his calculations, which is not beyond possibilities.
Since humans have been on this earth we have been fighting off viruses Mers SARS swine flu each time they have been different . True deaths of Covid not all the deaths and may have had Covid and saying died of Covid. Also the rest are flawed as well . The vaccine is not a cure and will not stop you from getting it . Also please explain to me how they have been trying to come out with a safer vaccine but have not been successful because of all the side effects with animal test subjects . It is amazing to me how fast they came out with this on with out all the test and the quick push through with barley any studies. Herd immunity last I checked I am not a herd of anything sheep cows or any other animal . Please look beyond what is being spoon fed . Side effects from vaccine??? Hmmm there are none right?
I gathered so much info. from the Comments. The Number of deaths are very close to what I had written down in October of 2020. It was not easy to come by this information ( which bogels the mind). To my knowledge, the numbers from the U.N. are obtained from the CDC, so sadly, no comparison contrast there. Not looking to be right, just searching for the Truth. GOD Bless everyone and Thank you for all your time and research, most helpful!
All any of us want is simply the honest facts, not theory, not opinions, not herd consent, not media information, just the plain hard truthful facts. So many are confused and frankly either do not know what to believe OR willing believe everything they see and hear on the six o’clock news. Very sad.
Comments are closed.