
New Covid-19 graphs from Christopher Bowyer. ONS data here. NHS England data here. (The ONS data is up to the end of week 39, 25 Sep. The NHS data is generally more recent, see each graph for the date.)
All graphs can be clicked to enlarge.
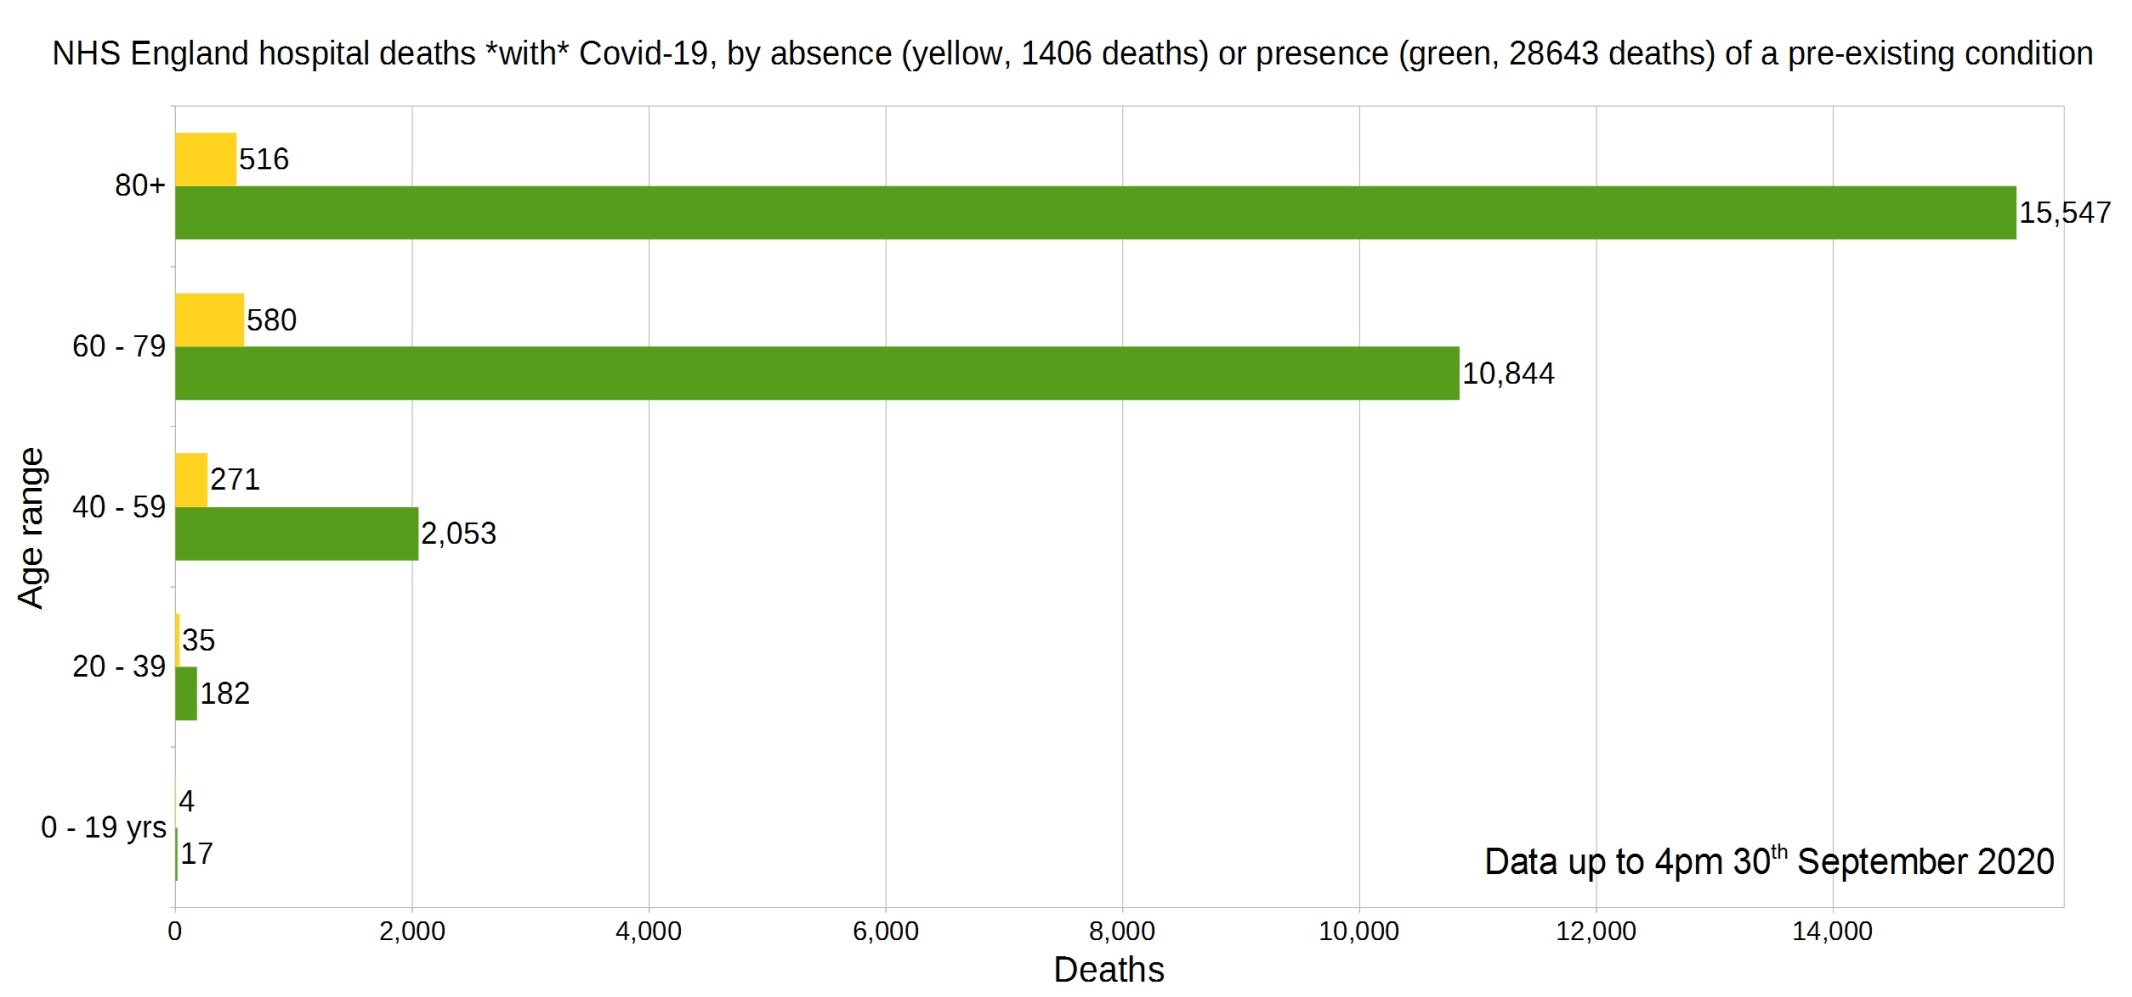
England deaths with Covid-19 by absence (yellow) or presence (green) of a pre-existing condition. Data from NHS England.
Percentage of deaths with Covid-19 by pre-existing condition. (95% have one or more P.E.C.) NHS England data.
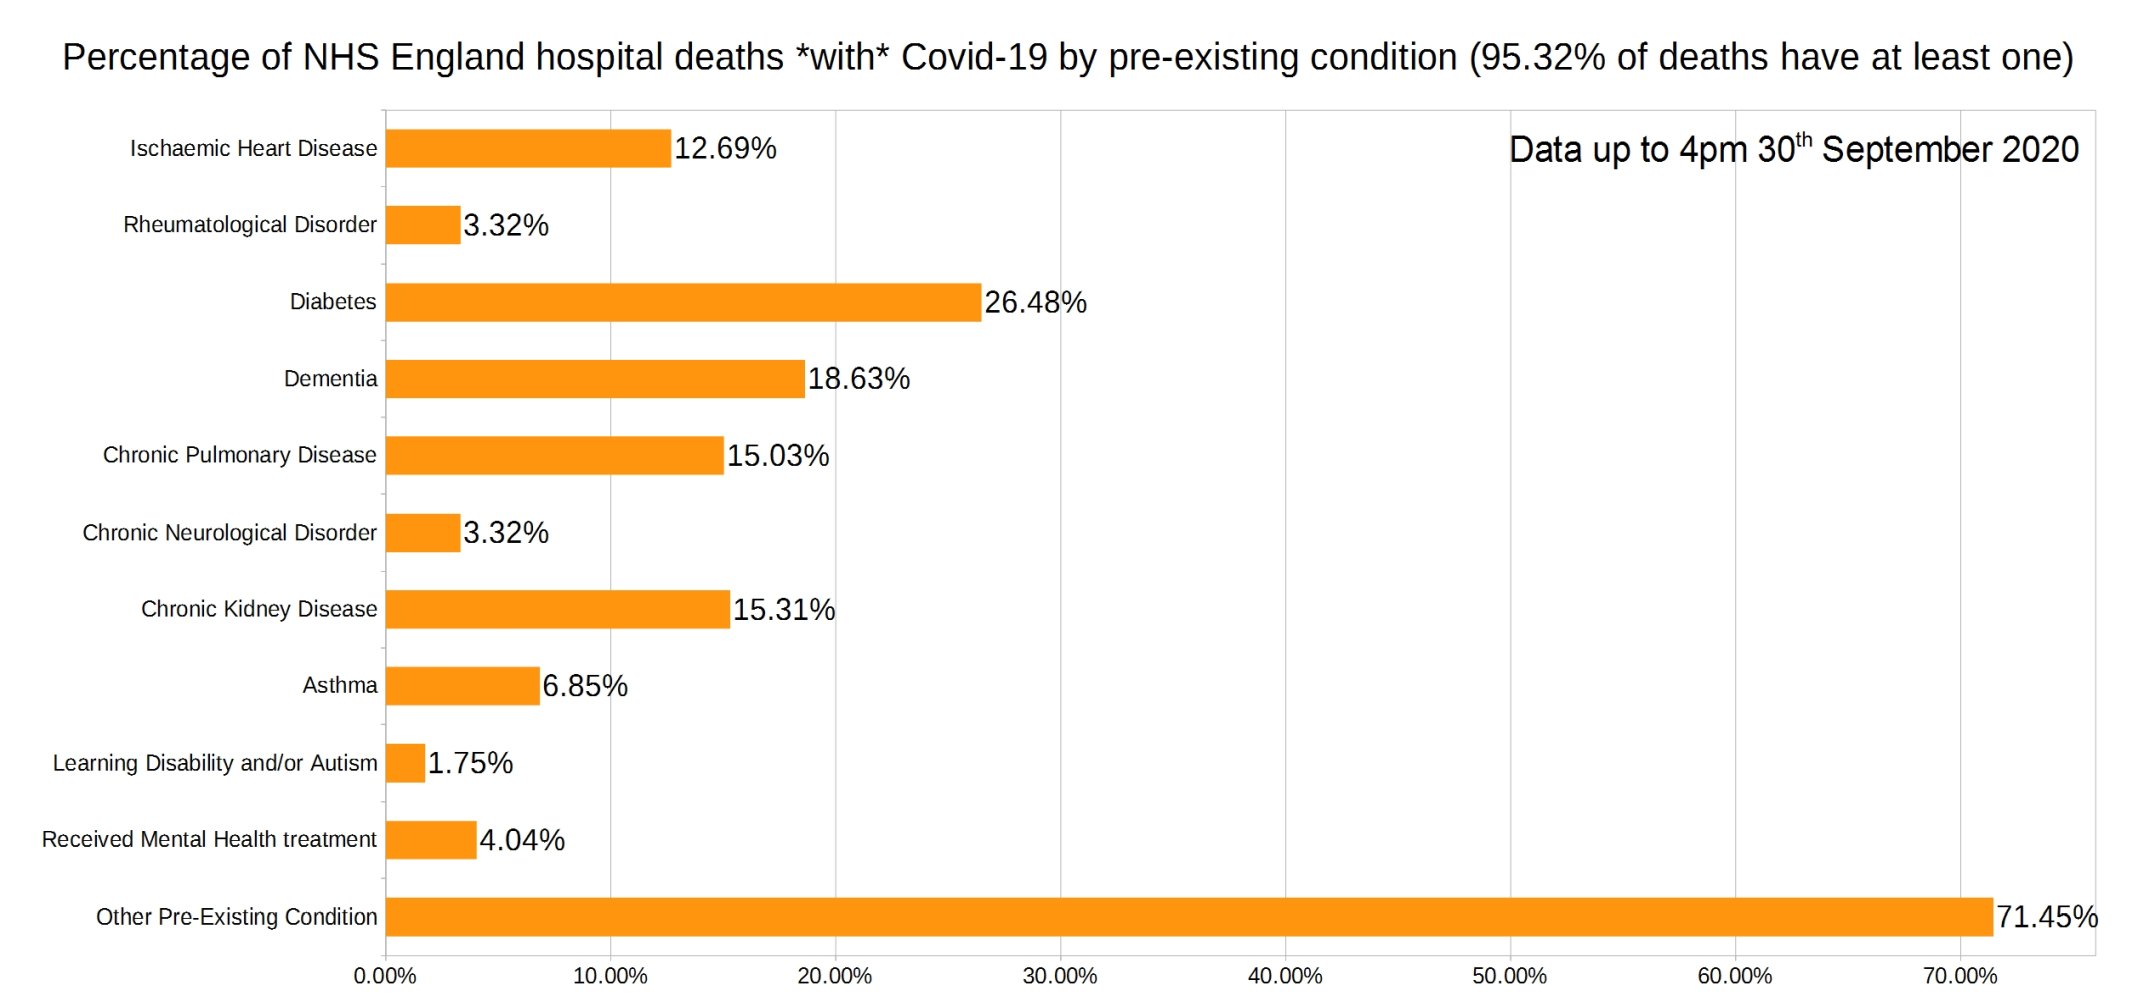
Note that the most common pre-existing conditions are diabetes, followed by dementia, chronic pulmonary disease, and chronic kidney disease.
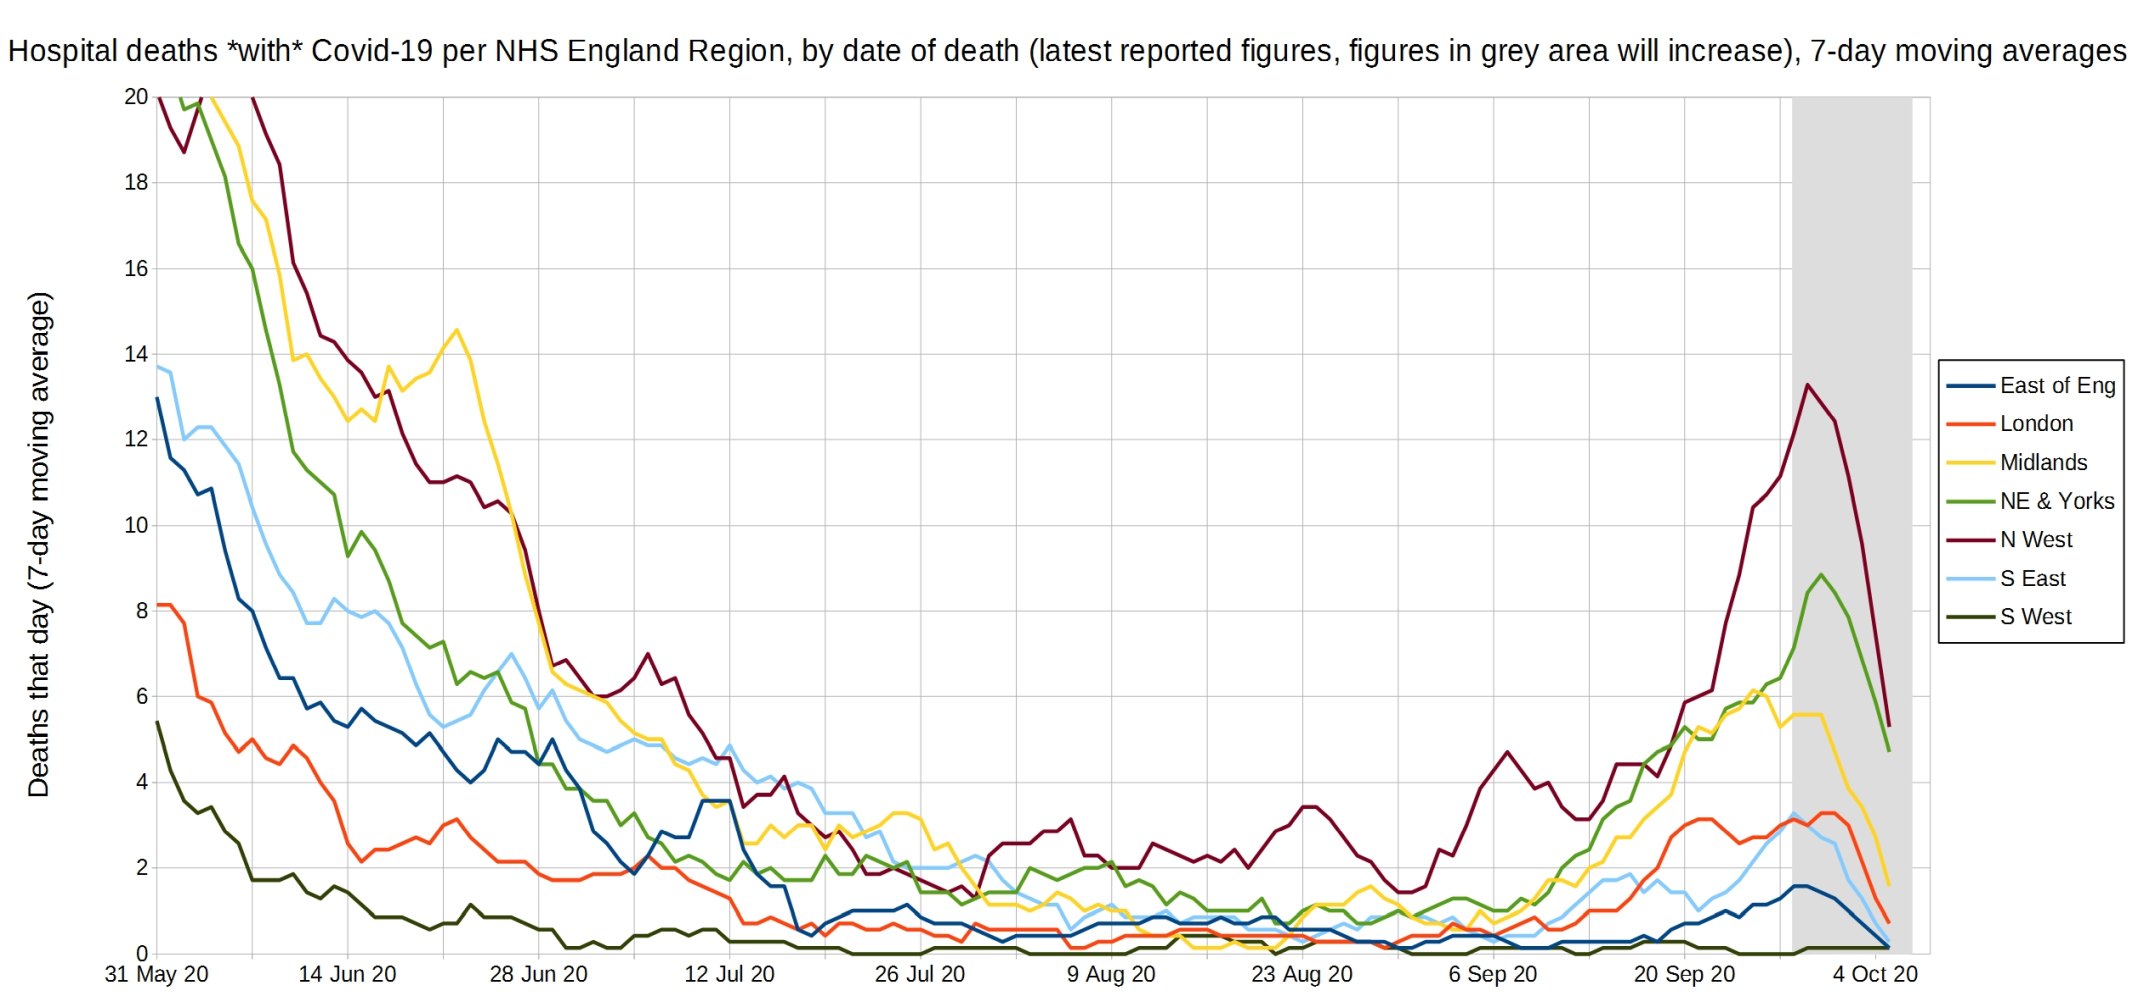
Trendlines (7-day average) for Covid-19 deaths by England NHS region, by date of death. (Note that the numbers in the grey area may increase over the next few days.) NHS England data.
Trendlines (7-day average) for Covid-19 deaths per million by England NHS region, by date of death. (Note that the numbers in the grey area may increase over the next few days.) NHS England data.

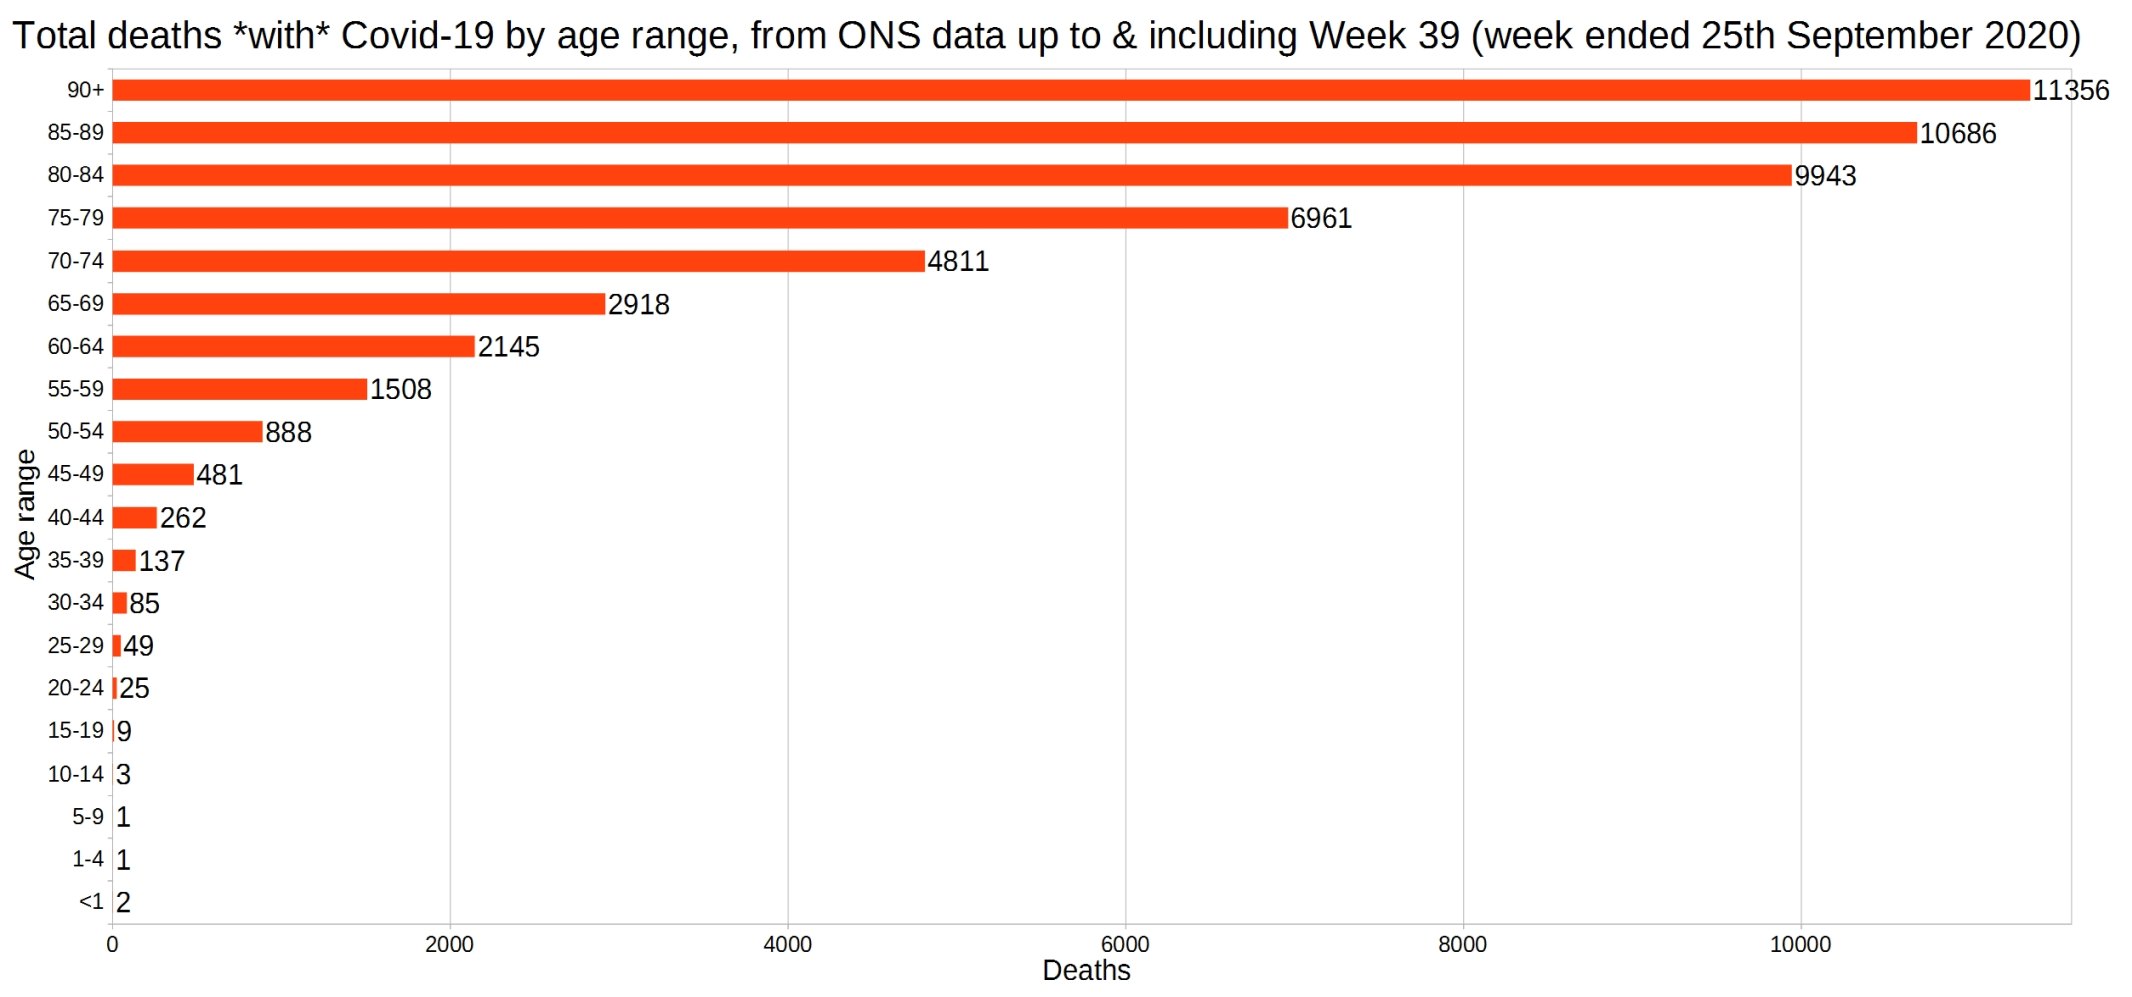
England and Wales total deaths with Covid-19, by detailed age range. ONS data.
ONS England and Wales Covid-19 deaths as a proportion of all deaths registered that week.

Of this graph, Christopher says:
Back in the Spring, it took two weeks to go from 1% (week 12) to 21% (week 14), up by a factor of 21 in a fortnight. But in the autumn, it has taken two weeks to go from 1% (week 37) to 2.2% (week 39) – up by only a factor of 2.2 in a fortnight. It’s not so much a “second wave” as a tiny ripple.
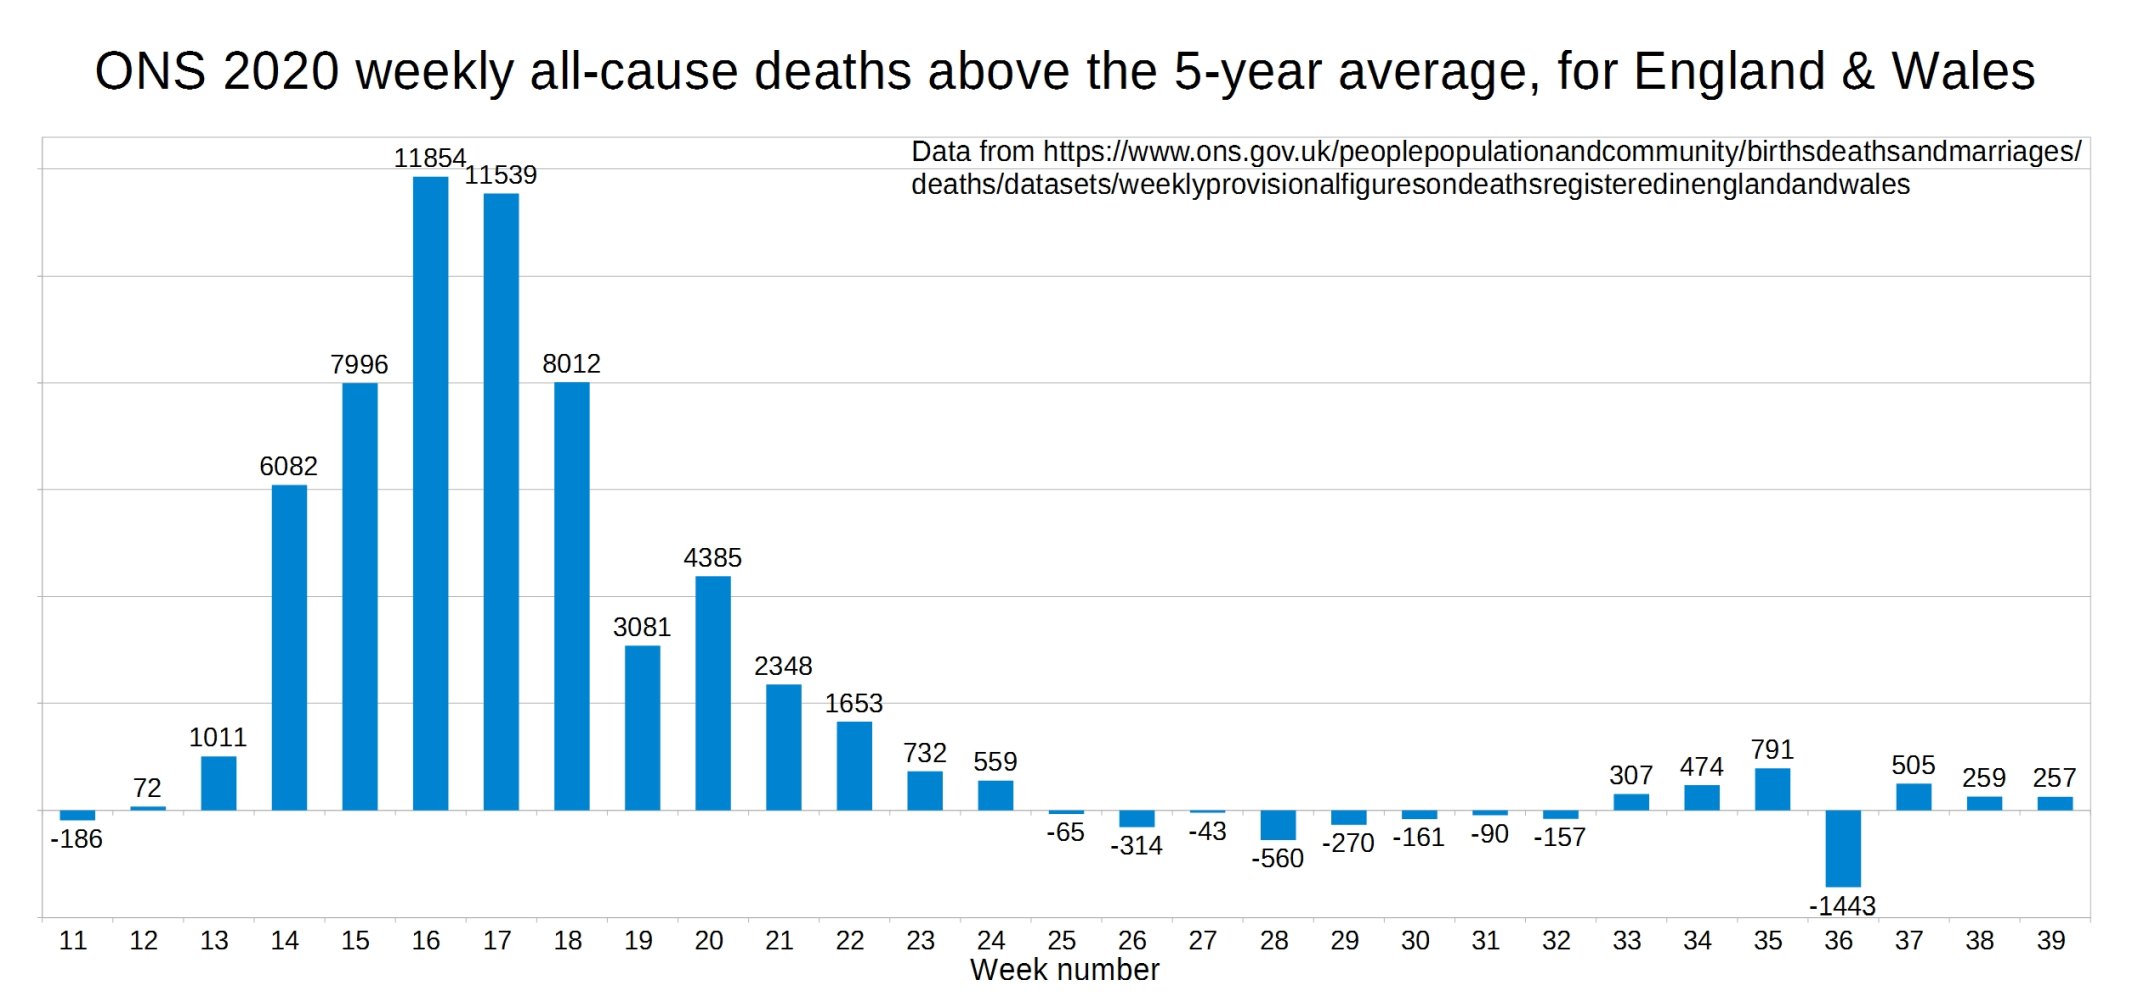
ONS England and Wales weekly all-cause deaths compared with the five-year average.
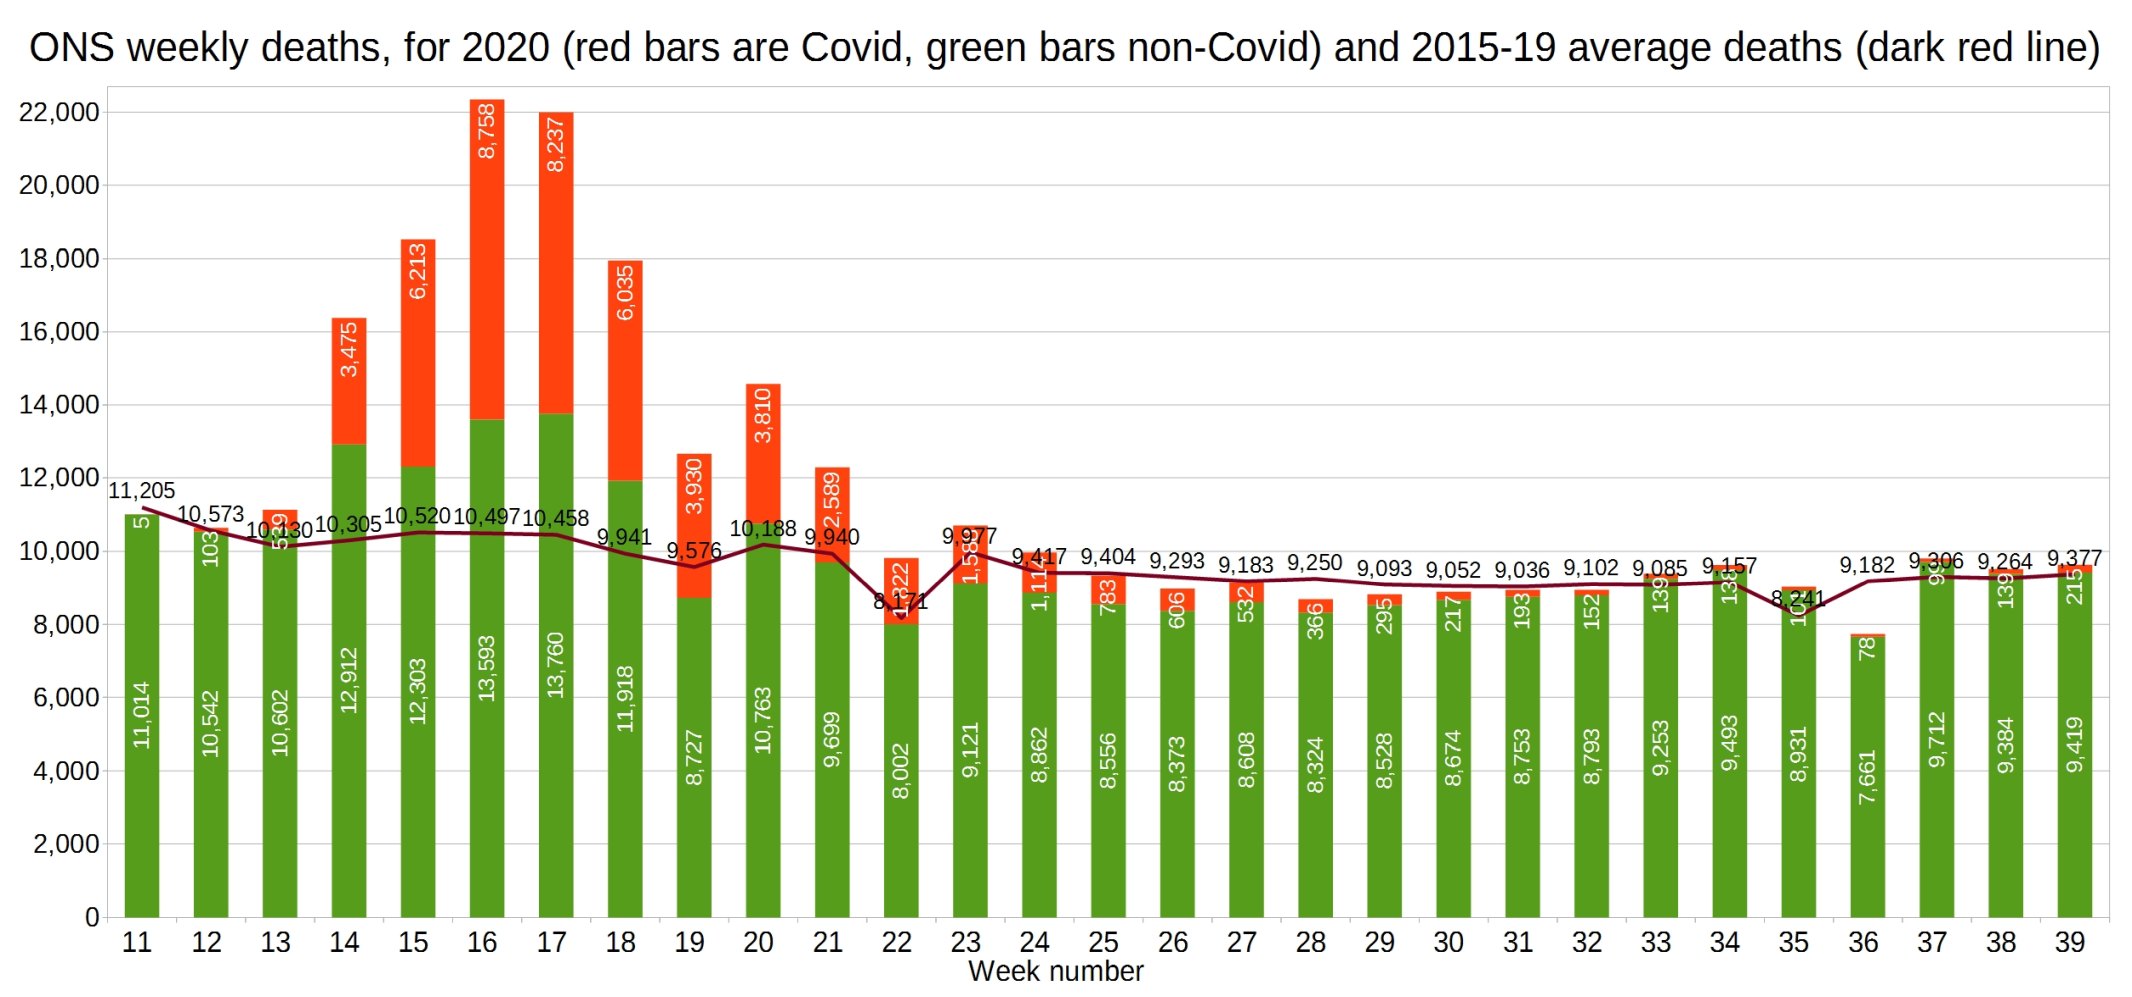
ONS all-cause deaths for 2020 vs 2015-19 average.
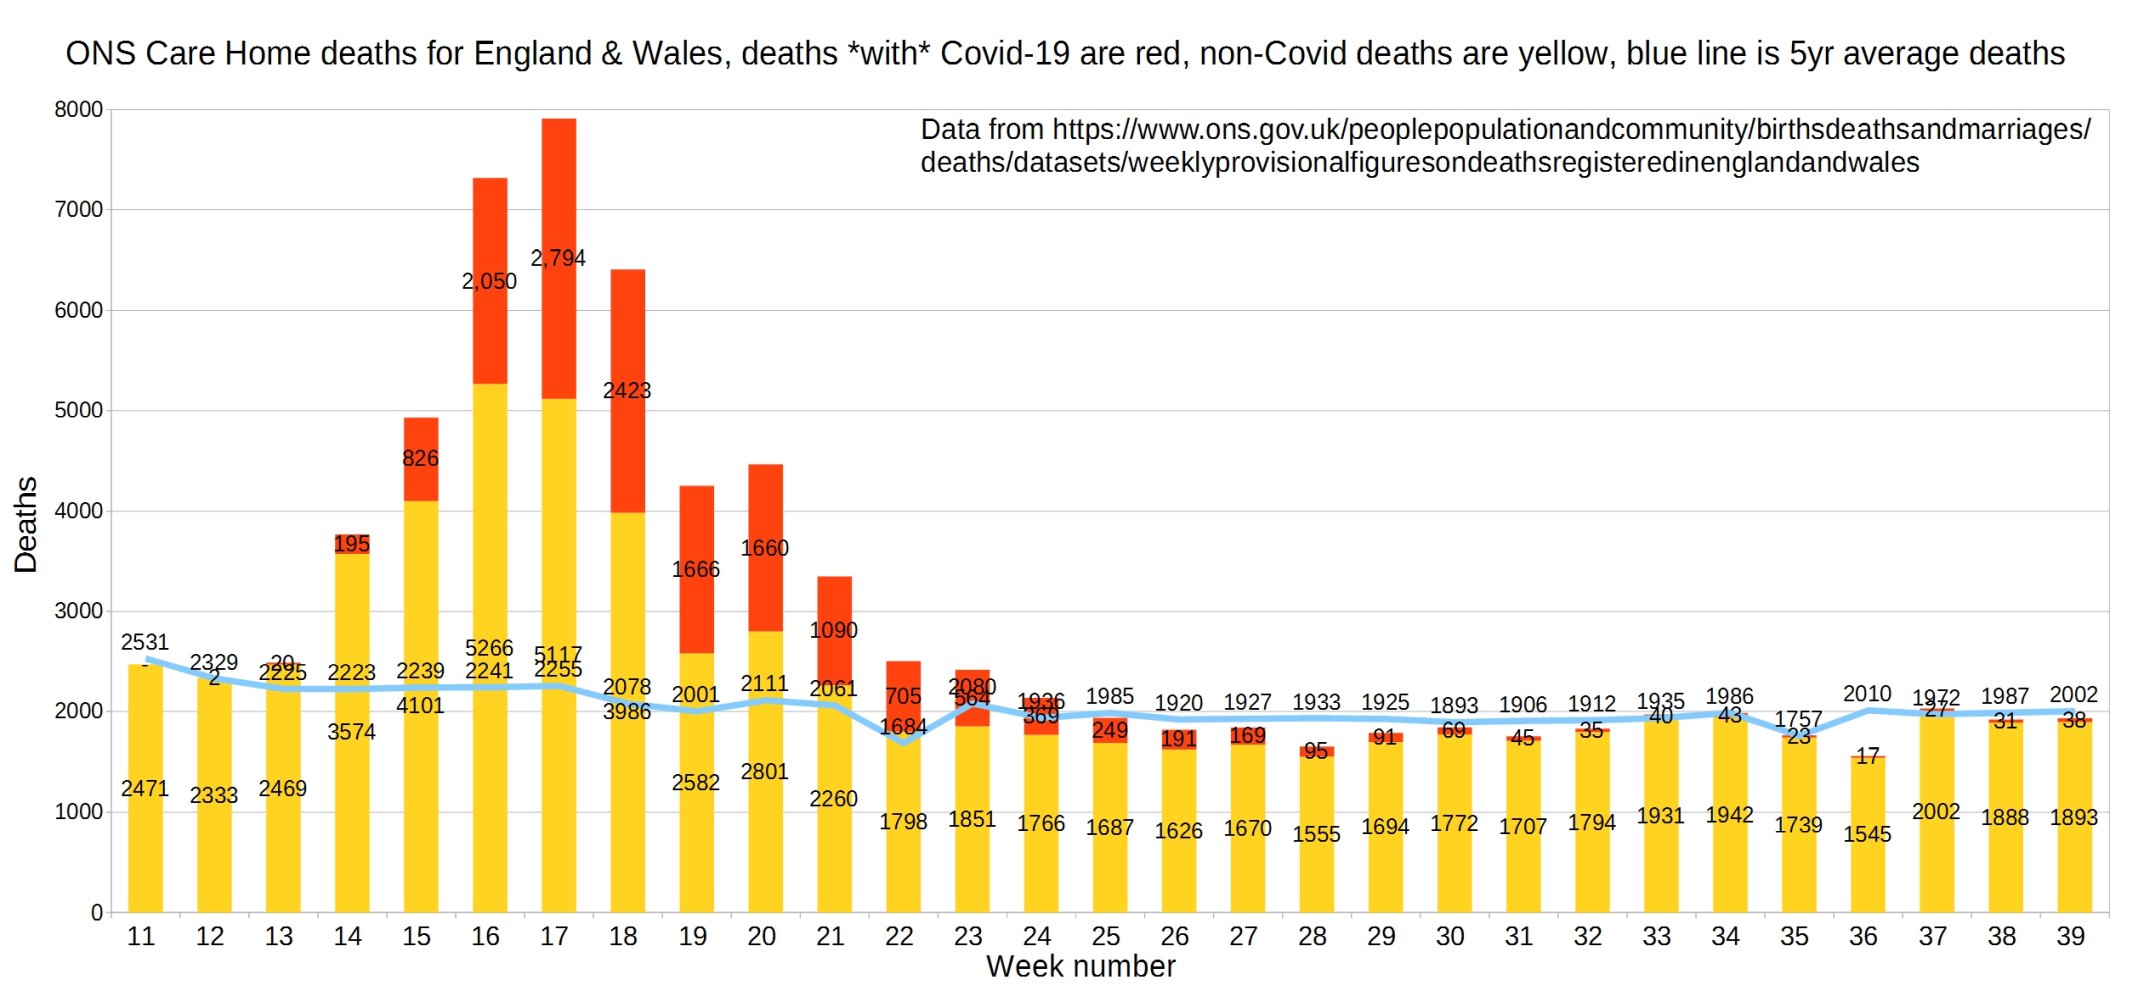
England and Wales weekly Covid and non-Covid care home deaths. ONS data.
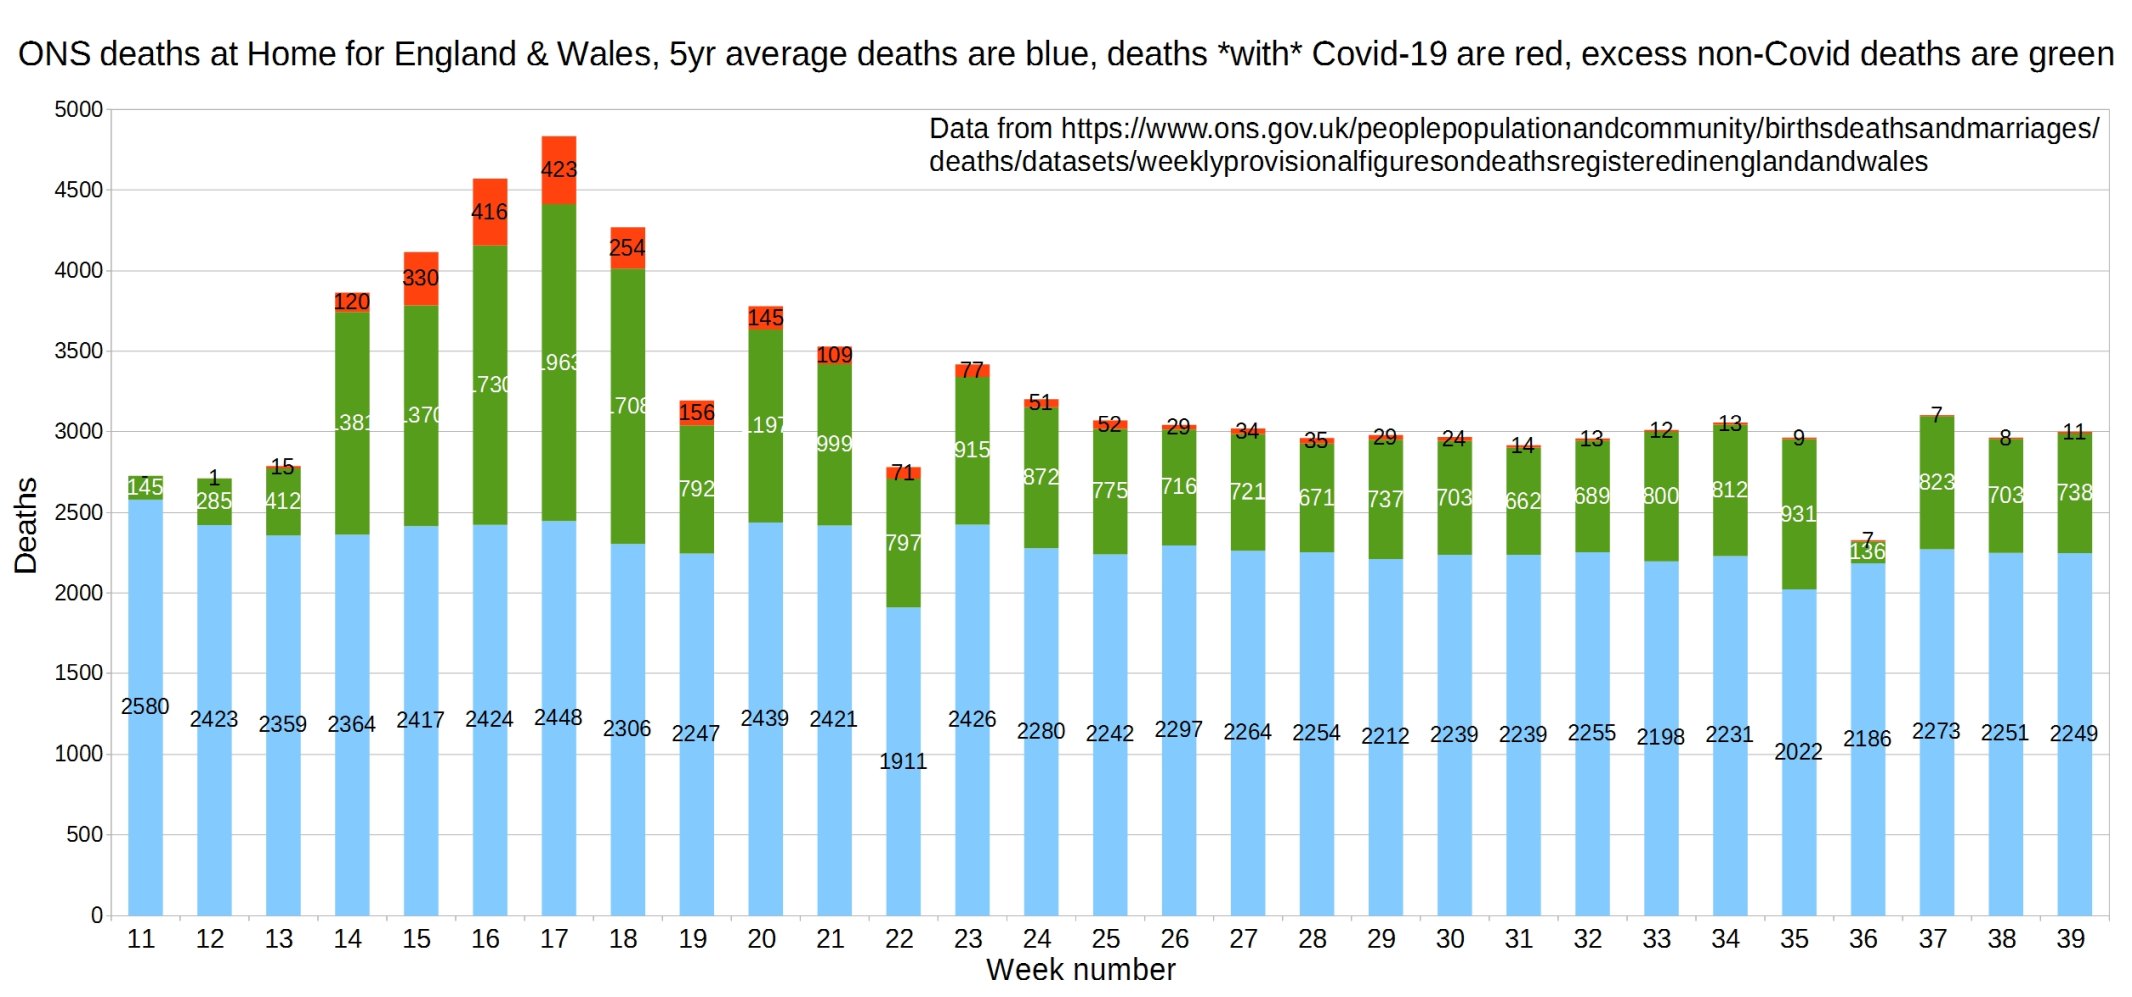
England and Wales weekly Covid and non-Covid deaths at home. ONS data.
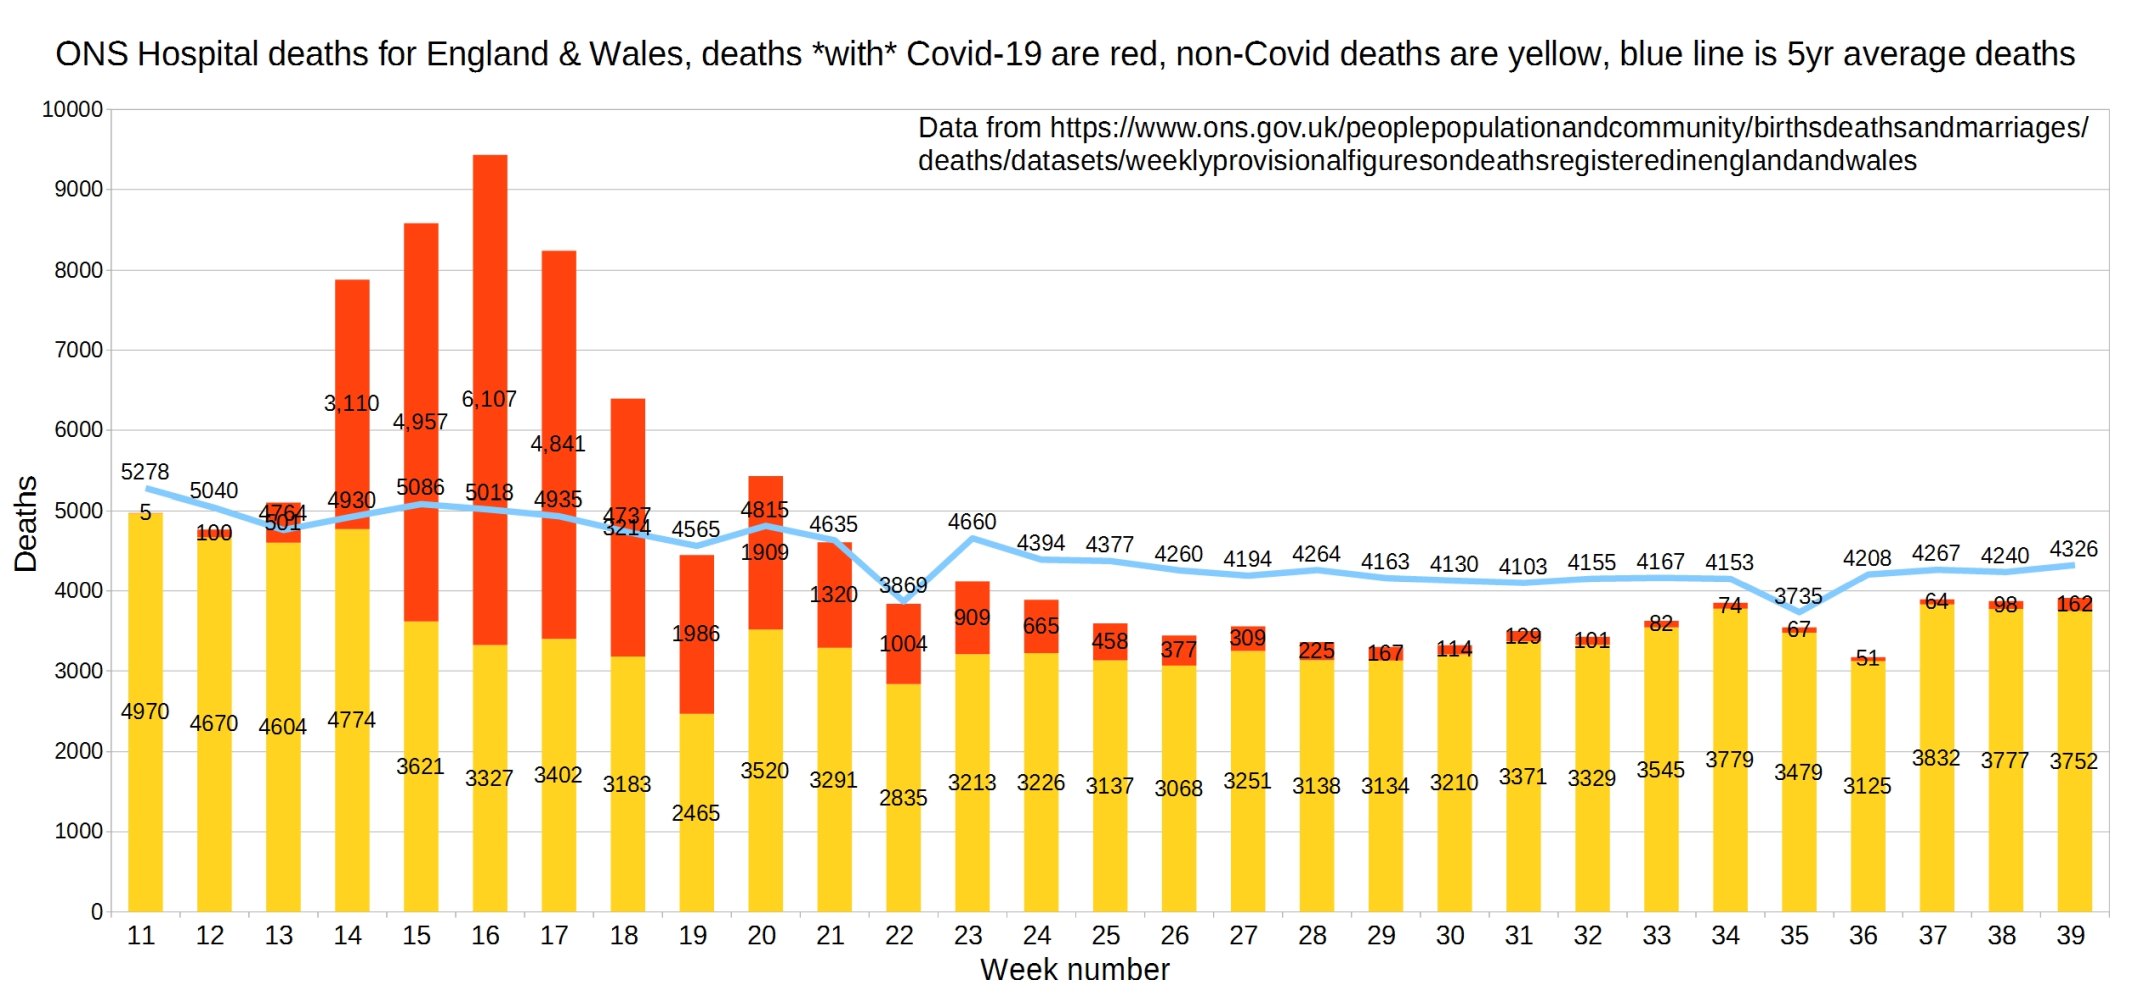
Hospital deaths for England and Wales. ONS data.
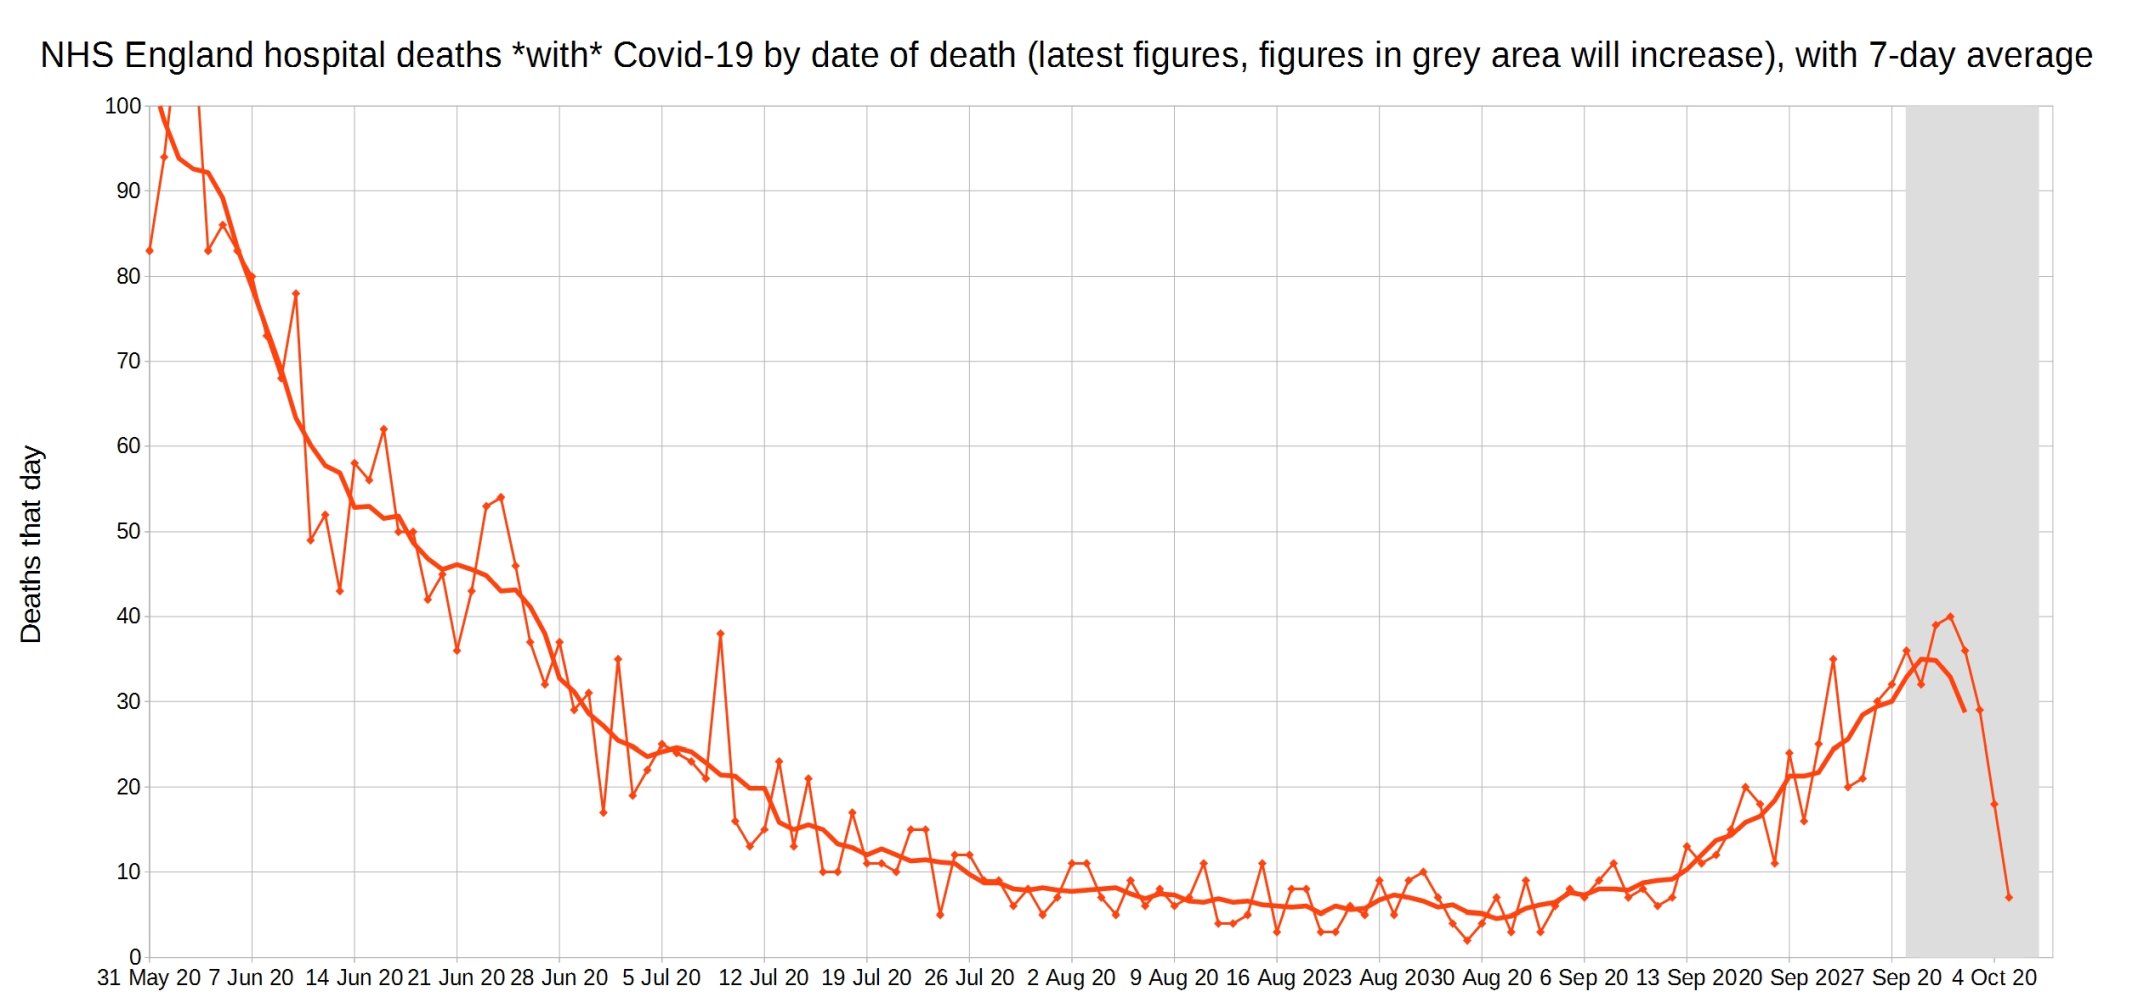
NHS England hospital Covid-19 deaths each day, latest reported figures, with 7-day moving average trendline.
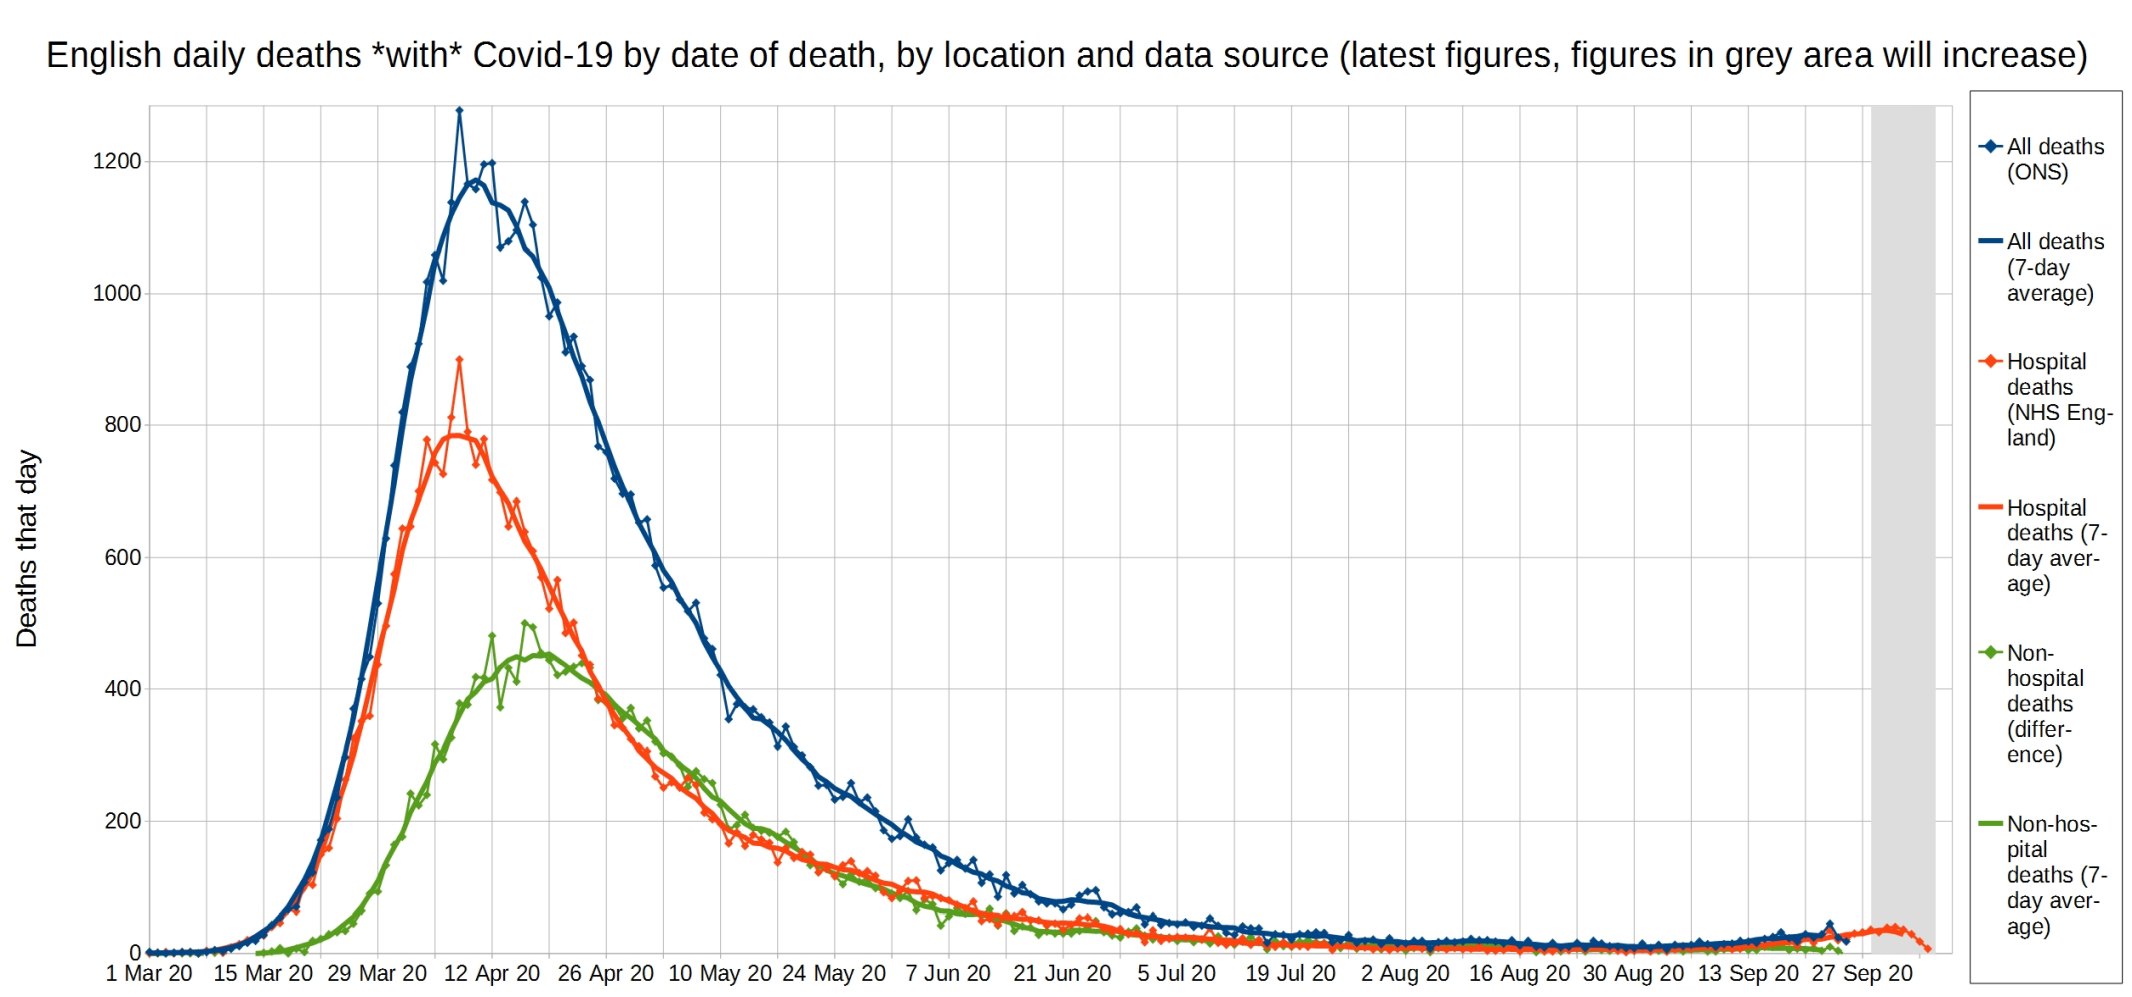
All Covid, hospital Covid, and non-hospital Covid deaths in England each day, with 7-day moving average trendlines.
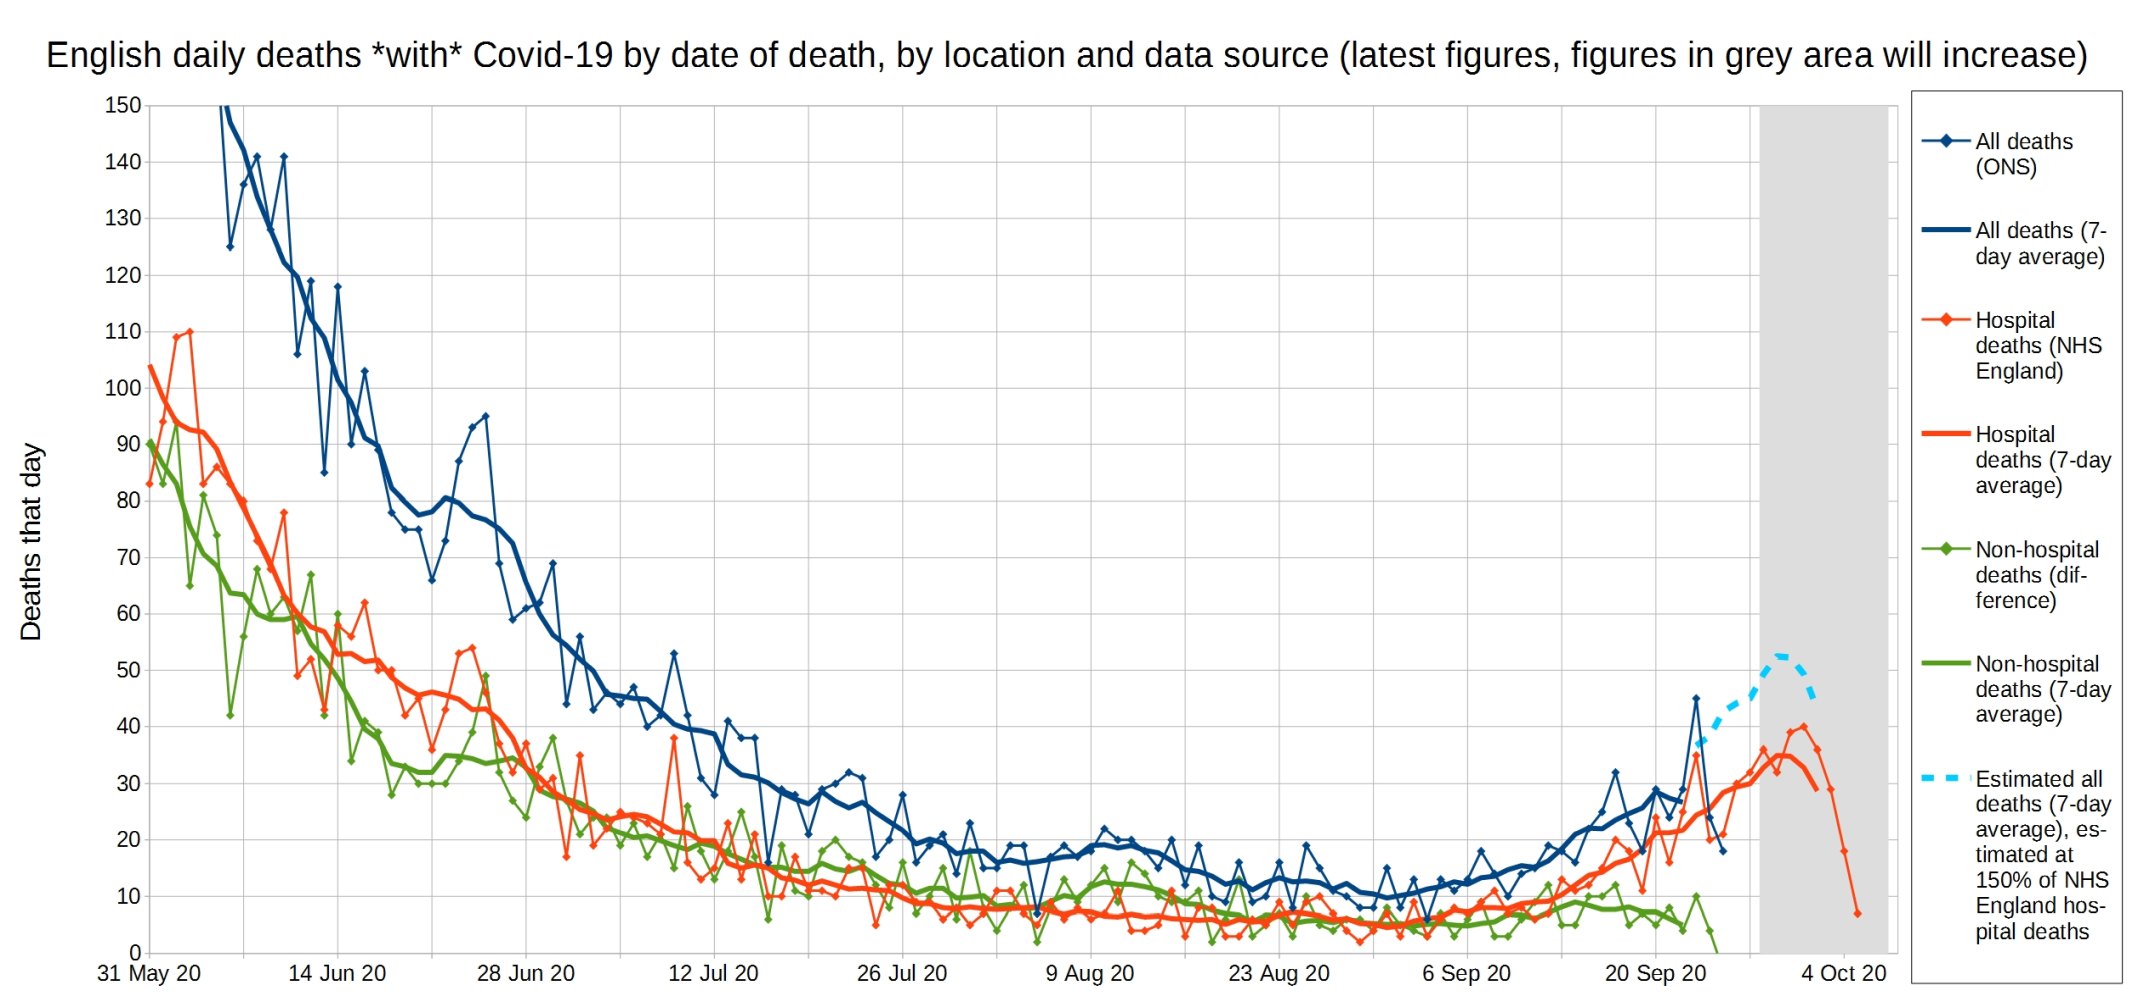
A close-up of this graph, looking at recent weeks.
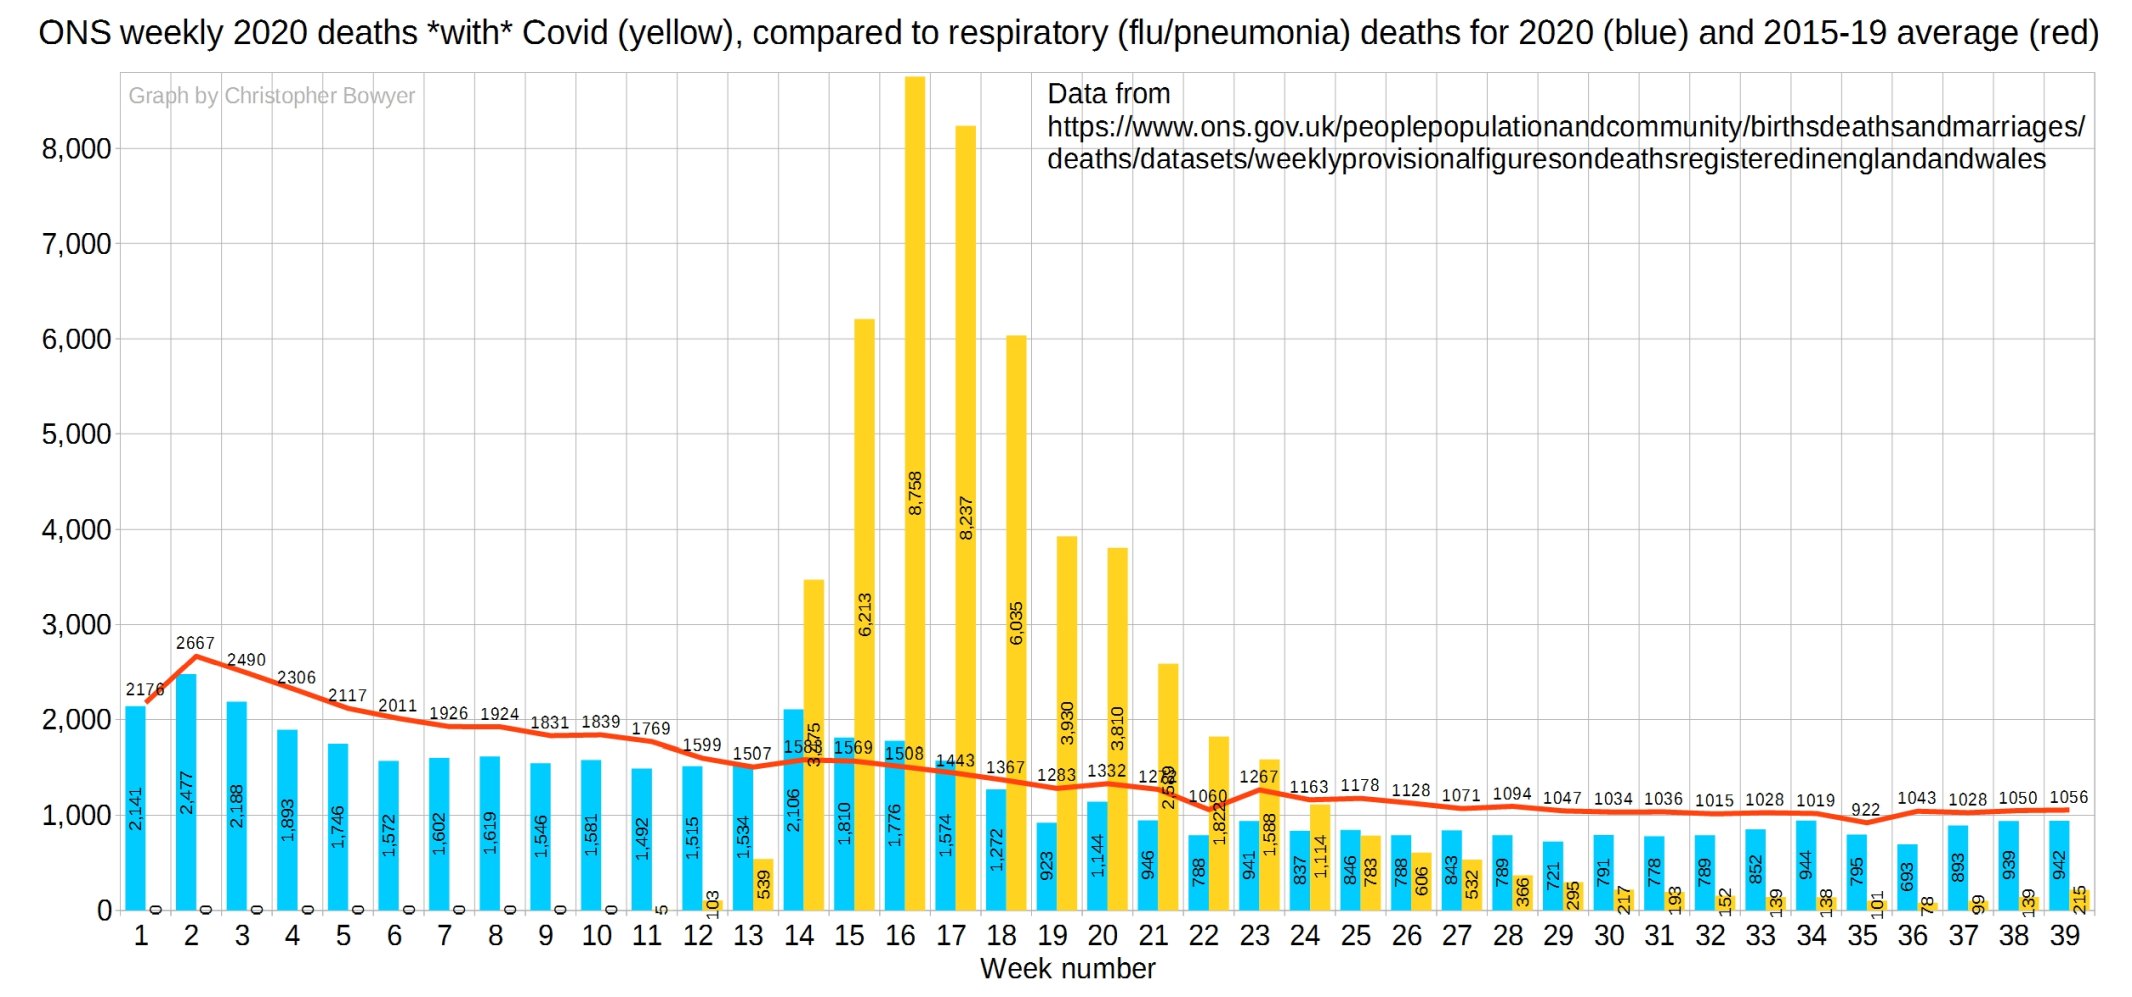
And here’s a new graph: ‘with Covid’ deaths (yellow) compared to flu and pneumonia deaths (blue), with the red line the five-year average for flu/pneumonia.
Update: Please support this website by donating via KoFi, subscribing via SubscribeStar or Patreon, or buying my book (see right-hand sidebar for links). Independent media like Hector Drummond Magazine, and my constantly updated Twitter and Parler accounts, cannot survive without your support.
9 thoughts on “Week 39 graphs from Christopher Bowyer”
I sent these graphs to a bedwetter friend. I now need to get past the “why should I believe those people?” stage. Do you have any links where I can follow up on Christopher Bowyer, what’s his expertise and how to download an process the data? I’m sure it’s already been done but a quick idiots guide would be very useful.
Many thanks in advance for your patience!
Because ‘these people’ are the Office for National Statistics, and NHS England, they are the source of the numbers, as stated in paragraph 1 of the post.
You’re not seriously suggesting that Christopher Bowyer provide evidence of his ability to draw graphs using other peoples numbers are you?
My thoughts are that given the enormous pressure on the statisticians to support government ‘policy’ and the media’s fear mongering, its absolutely amazing that they can’t produce better numbers in support of the ‘hype’. The last graph says it all I think.
Chuckles.
-fair point, but my friend, like most of his ilk, is a sucker for the argument from authority fallacy.
Christopher, informative as always. Maybe Professor Angus Dalgleish is a reader
The Excellent and Pragmatic
Worth reading, Professor Dalgleish nails Gov’t, NHS & MSM error and idiocy repeatedly
The Tyrants of
NHSNC-19HSTheir justification: too confusing to only have to wear in shops, make it everywhere outside home
Note: BMA is a Trade Union (many MDs do not join); it is not the GMC
Completely ignores: Face Masks can Kill
I have not and will not wear a virtue face mask for C-19. I do wear a proper mask/respirator when necessary
@Seeker24
Ask them to read Professor Angus Dalgleish’s article
Mask wearing rules didn’t stop Spain from having a significant wave.
Pcar: “The Tyrants of NHS NC-19HS”
Have you noticed the NHS now have the cheek to run TV ads telling people to see their GPs if they have conditions which might be cancer? This is after they stopped cancer treatments for many patients and while some GPs still seem reluctant to conduct in-person appointments.
@Dene
Yes. It’s sickening and Gov’t lies – where’s ASA?
Mother (80+): phones surgery “I need to speak to a doctor”; “You can’t, phone back tomorrow at 8am to request a call from doctor”; “Can’t he phone me today?”; “No”
Aunt: 74 and on home oxygen: “I need to see a doctor, please send one”; “No, we need a sputum sample first, bring it to surgery”; “I can’t”; “Find someone who will, bye”
More NHS Closed, NC-19HS Open:
Excellent:
And
https://lockdownsceptics.org/2020/10/11/latest-news-159/#the-year-the-nhs-failed-the-people-of-britain
Also on page
“~25% of Pillar 1 “cases” are patients who have caught C-19 in hospital”
That’s more than the <5% caught in hospitality venues. Should NHS be closed to protect public?
I just totted up cumulative YTD numbers for flu v covid. Used the new graph.
49,366 v 50,499!
Comments are closed.