
I’m not usually a big fan of making predictions. I love the quote, reputedly from Nils Bohr: Prediction is very difficult, especially about the future. But I’m going to go out on a limb here, and say I don’t think the graph showed by Boris Johnson’s ‘scientists’ recently, of over 6000 deaths a day in the UK by end of December, is going to happen. The fact that it was even shown I find just embarrassing. As a Brit. I’m not sure if it’s because it’s so scientifically illiterate, or whether it’s evidence that the authoritarian elite have so little respect for the people of Britain that the can just put up such transparent garbage, to get what they want. Which appears to be the destruction of our wealth and way of living.
But there clearly are additional hospitalisations and deaths currently happening in the UK and in other places. My proposal is that this is because the epidemic was artificially suppressed in April and now, reality is catching up again. The Grim Reaper wants his souls. And I think we can make a reasonable prediction of how many he is coming for, based on how many we tried to prevent him getting the first time round. Apparently, deaths during respiratory epidemics normally follow the Gompertz curve, a feature of which is the straight line decline once the epidemic has peaked. A comparison between Sweden and the UK shows this. (All graphs can be clicked to enlarge.)
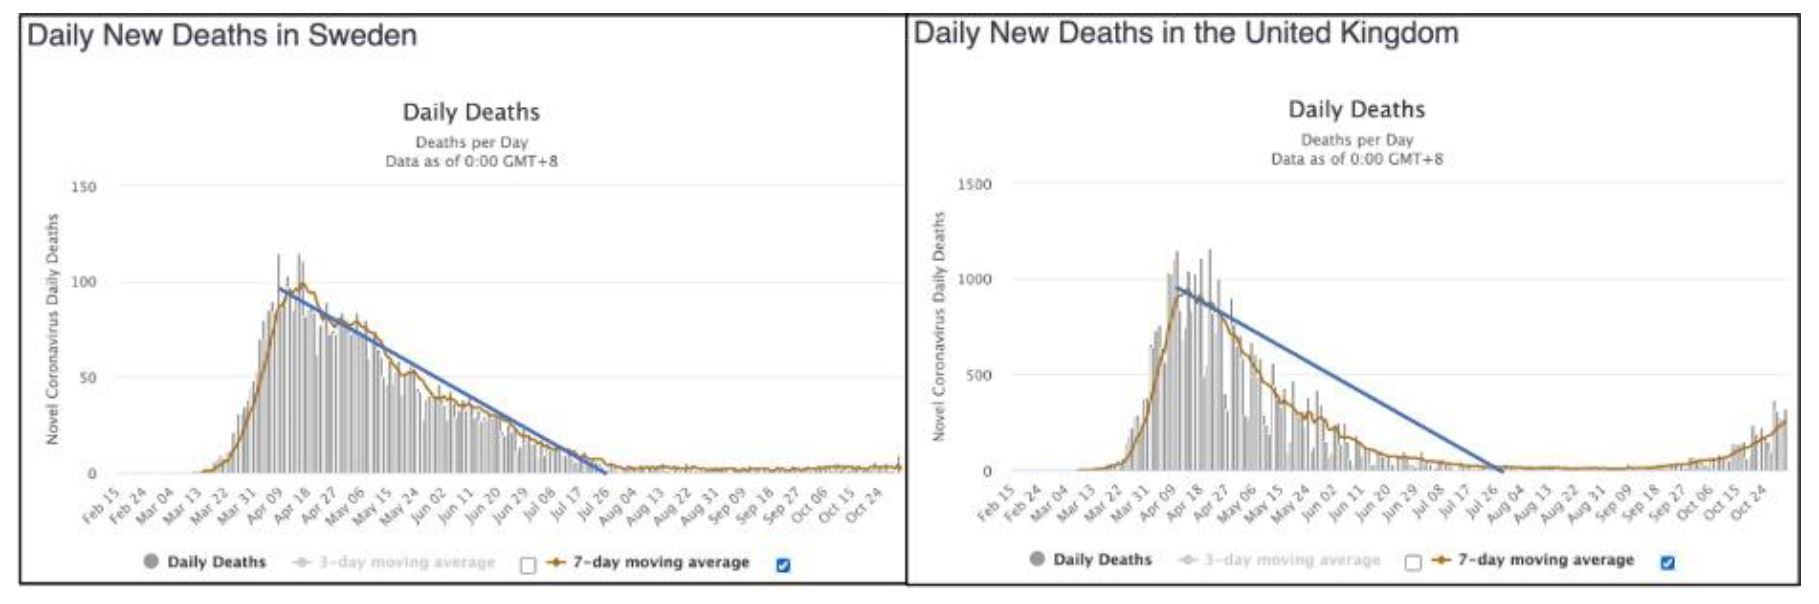
The artificial suppression of the virus progress back in March and April took the UK off the natural Gompertz trajectory. The change in the slope is clearly visible around the last week in April. What I am proposing here is that those lives which were saved from the end of April through to the end of July were only really delayed deaths, as this virus is not eradicable. And now they are due. And they are also predictable. If we look at the UK in more detail (showing actual 7 day average death counts):
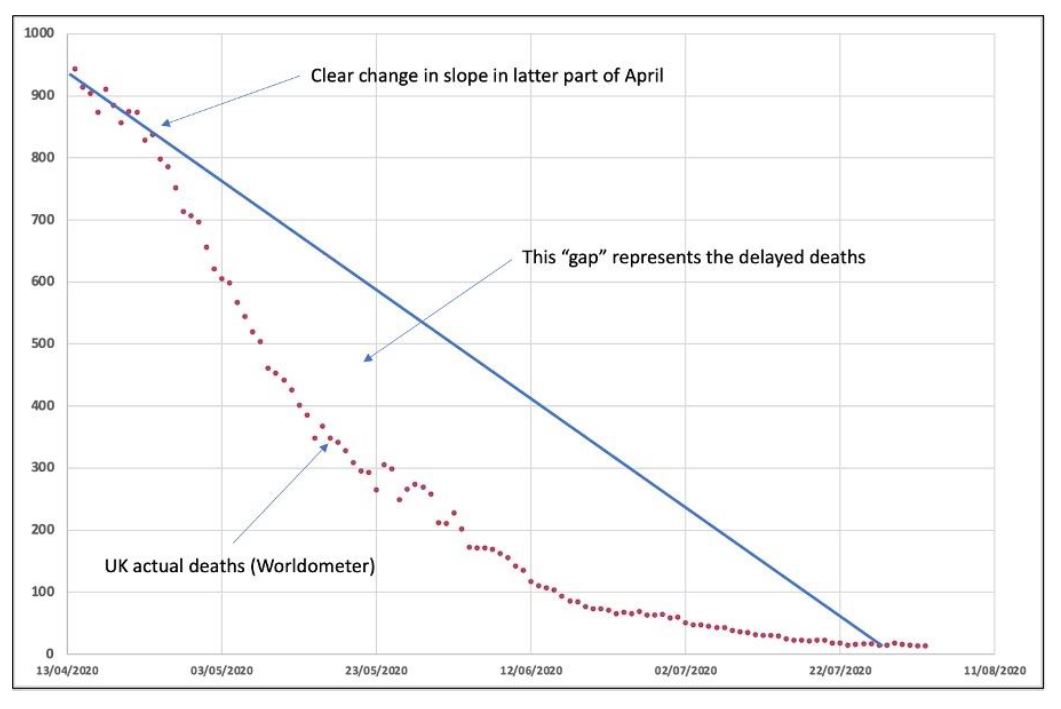
And then all I have done is the graph up these daily ‘missing deaths’ as the difference between the red dots and the blue straight line, and overlay them against what is being observed as the second wave. As below:
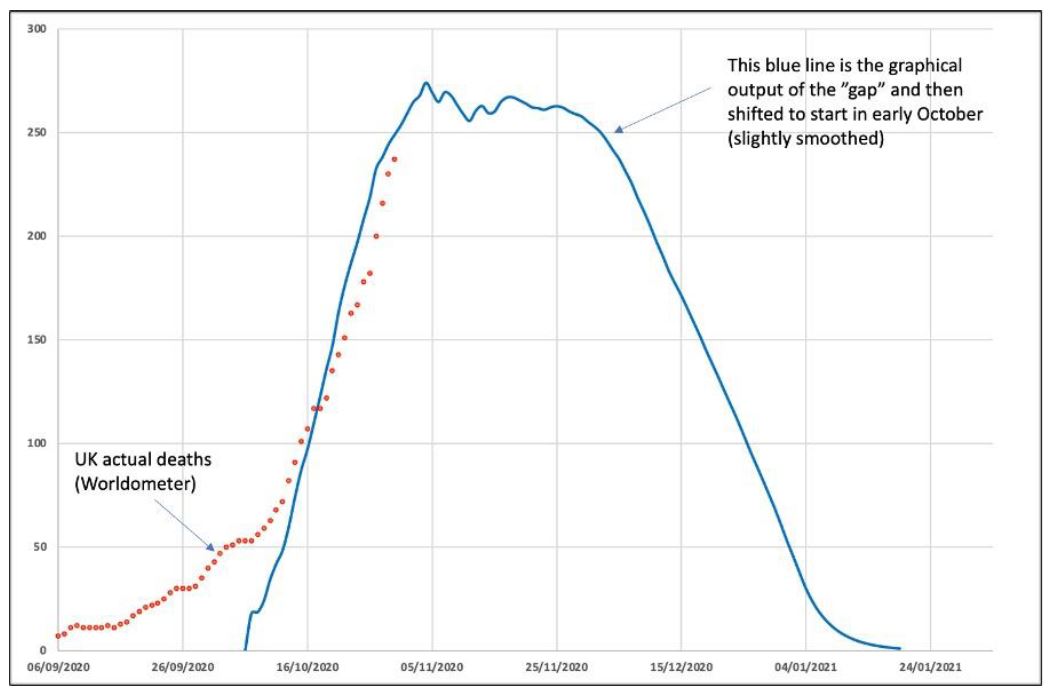
This “model” would suggest that deaths will peak within about a week and after a month they will plateau at numbers between 250 and 300 per day and then very rapidly decline through December. Just in time for a happy Xmas.
Now of course this could be complete nonsense. But I thought it would be good to put out an alternative hypothesis to the rubbish that Boris Johnson has based his reasoning on. One thing is for sure, I think my ‘prediction’ will be a little closer to the actual outcome than his. Time will very shortly tell.
Update: I’ve just realised that Lockdown Sceptics published this piece earlier today, but as it was also sent to me with nothing about exclusivity I’m going to leave it up.
11 thoughts on “Anon: The Grim Reaper Is Still Owed A Few Souls”
This is an interesting analysis, and passes the basic sanity check (for what within my mind can be considered sane at any rate). However I do think it a little simplistic in that we are not looking at a static target here; the vulnerable population is constantly in flux and many more factors are in play, especially as we enter the ever so normal winter months of higher mortality.
The author should be able to derive some testable predictions from this model. The area between the line and the curve for the downwards part of the graph (relative to population) appears to be in order of size (biggest first): NI, SCO, WAL, ENG. Could possibly do it for our European neighbours too – again just visually looking at 3 examples (biggest first): SPA, ITA, NL. Sorry, don’t have the inclination to do the actual numbers myself (too lazy!)
Witless and Unbalanced’s ‘data’ which is what they call brainless computer model output has been well and truely rubbished yesterday and today. I only hope the select committee have enough brain cells between them to use the briefing they can get by reading the front pages of many papers today to show these two scoundrels the door. They will of course fall back on the excuse that they were only showing Johnson &co the worst case, its up to the government what to do with it. If Johnson doesn’t instantly sack them if they pull this one, then he in turn should be asked to resign as he is obviously is suffering from ‘long covid’. God knows which half wit would replace him!
Or the Swedes have a better/faster reporting system? The data shows the date on which deaths are reported, not when they occurred, which may have been days, weeks prior. We do know UK reporting of deaths has not exactly been accurate or competent.
This is why deaths on some dates are multiples higher than the day before then plunge the next, then back up again. If you eyeball the UK data and even out the ups and downs the curve becomes smoother like Sweden’s.
However the shape of the curves match if deaths per million are used to correct for population sizes… Ivor Cummins video shows this… https://youtu.be/8UvFhIFzaac
50% of deaths were in care homes, where lockdown can have made no difference. And since it is about 28 days from infection to death, the epidemic peaked prior to lockdown. The effects of lockdown (if any) would have taken at least a couple of weeks to show up, so many of the deaths on the curve were from infections prior to lockdown or any possible effect.
Deaths from respiratory infections are currently below five year average, which suggests those who now would be dying, died months ago, and deaths from ‘flu and pneumonia exceed deaths from Covid-19, which is rather the opposite of the point made in the above article.
An interesting approach to compare UK and Sweden cumulative deaths. The author suggests that Sweden’s data follows a Gompertz distribution whilst the UK didn’t, attributing this to suppression of the virus by the NPI of the first lockdown.
Unfortunately, the statement that the Gompertz function predicts a linear decay in deaths once passed the peak is incorrect. The Gompertz function has an exponential decay which is almost perfectly followed by the UK mortality data. Plotting the log of deaths versus time will reveal a straight line. Thus the UK mortality followed a near perfect Gompertz pattern and Sweden deviated somewhat from this.
My reading of the data since March is that we are close to a community immunity and the present deaths being reported are largely attributable to seasonal respiratory illness. There is no epidemic, no second wave. The initial wave petered out because of a significant Pre-existing immunity conferred by T-cells.
The present ‘crisis’ is being driven by the large number of tier 2 and tier 1 PCR tests. These of course, don’t report the number of active infections but the sum of false positives, those who had the virus in the past month or two and still carry ‘dead virus’, and those with an active virus. Combine this with ever increasing numbers of tests, a testing regime under stress with poor QA and the SAGE view that there is a large percentage of the population that are still susceptible and that the only factor suppressing the R(t) value is lockdown and social distancing then we have a manufactured, or pseudo epidemic.
I believe this view is also that of Mike Yeadon and others.
The government are either corrupt or idiots. I’m leaning to the latter.
Everyone in hospital is repeatedly tested multiple times.
If it’s a negative it’s ignored until a +ve test is obtained.
As has been discussed on this site before, the CT for the test is so high it’s picking up nonsensical data.
Hence the only reason the death rates are “increasing” is the continued mass testing of anyone who is ill in hospital. With 1600+ during a day from a Myriad of other illnesses it’s bound to have increasing numbers categorised as CV.
There are tens of thousand die outside hospital. If the gov are testing the numbers they claim (300k a day) for the past several weeks. Anyone one of them who died from cancer heart attack etc and tested +ve became media doom fodder to the gov to wave around.
It’s nothing but a data fiasco by people in Gov who will never admit they have messed this up.
Doug: “The government are either corrupt or idiots.”
Are those mutually exclusive? 🙂
Government is nothing but people, and we can all see that the people who get elected do not represent the cream of the human race. From our interactions with government offices, we also know that the people hired into the bureaucracies are (for the most part) not top tier people either.
But let’s not excuse the people in the legacy media. They have done an absolutely horrible job — misusing language; failing to provide any context for the risks; and failing to investigate the huge health & economic burdens being created by Lock Downs (NOT by the Covid virus). Meanwhile, China partys on, with life largely back to normal. Why do we have to look to a country run by a Communist Party to see common sense in action?
@PFD
My mathematics is pretty basic, but I thought a Gompertz curve was type of sigmoidal logistic function.
@John Church
It is a form of sigmoidal logistic function whose derivative (the plot of daily number of deaths versus time) has the form a b c exp (b exp (c t)) exp (c t). The constants are a = upper asymptote of the total number of deaths, b and c are the negative growth rates of the function and t is the time variable. Once past the peak, and in the tail of the profile it quite closely follows a single exponential function. i.e. the term exp (b exp (c t) tends to 1 and the tail is closely described by a b c exp (c t) – a simple exponential decay.
It is sometime since I’ve looked at the data and if I knew how I could post a plot of England daily deaths plus the best fit Gompertz function to show how past the peak the decay is approximated by a simple exponential function.
@John B
Really? NHS refused to admit any patients from care homes regardless of illness. There is video footage of ambulance crew refusing to take patient sitting outside door of care home.
On Tuesday a nurse was arrested for removing her mother from care home as she was sick and in despair. Care homes? Death Prisons for the old. Furthermore, Gov’t have repeatedly said they will send C-19 positive patients to them.
Protecting the vulnerable? Absolute BS, MPs protecting themselves from msm lockdown zealots
Read all here and weep
https://lockdownsceptics.org/2020/11/04/latest-news-183/
Just found this post now, and though it initially looks as though you were wrong, if we take into account we’re now effectively 3 months into another artificial suppression, your predicted peak isn’t that far off reality. Your predicted peak of early-to-mid November has been shifted to the middle of this last January.
Comments are closed.