Mark Ashby has sent me a very interesting graph using ONS data.
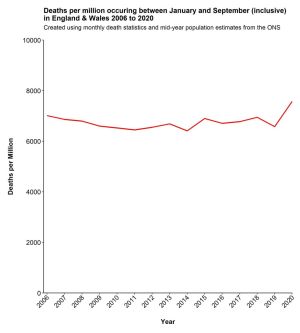
It’s for all-cause deaths per million occurring between January and September (inclusive) for 2006-2020, for England and Wales (click to enlarge).
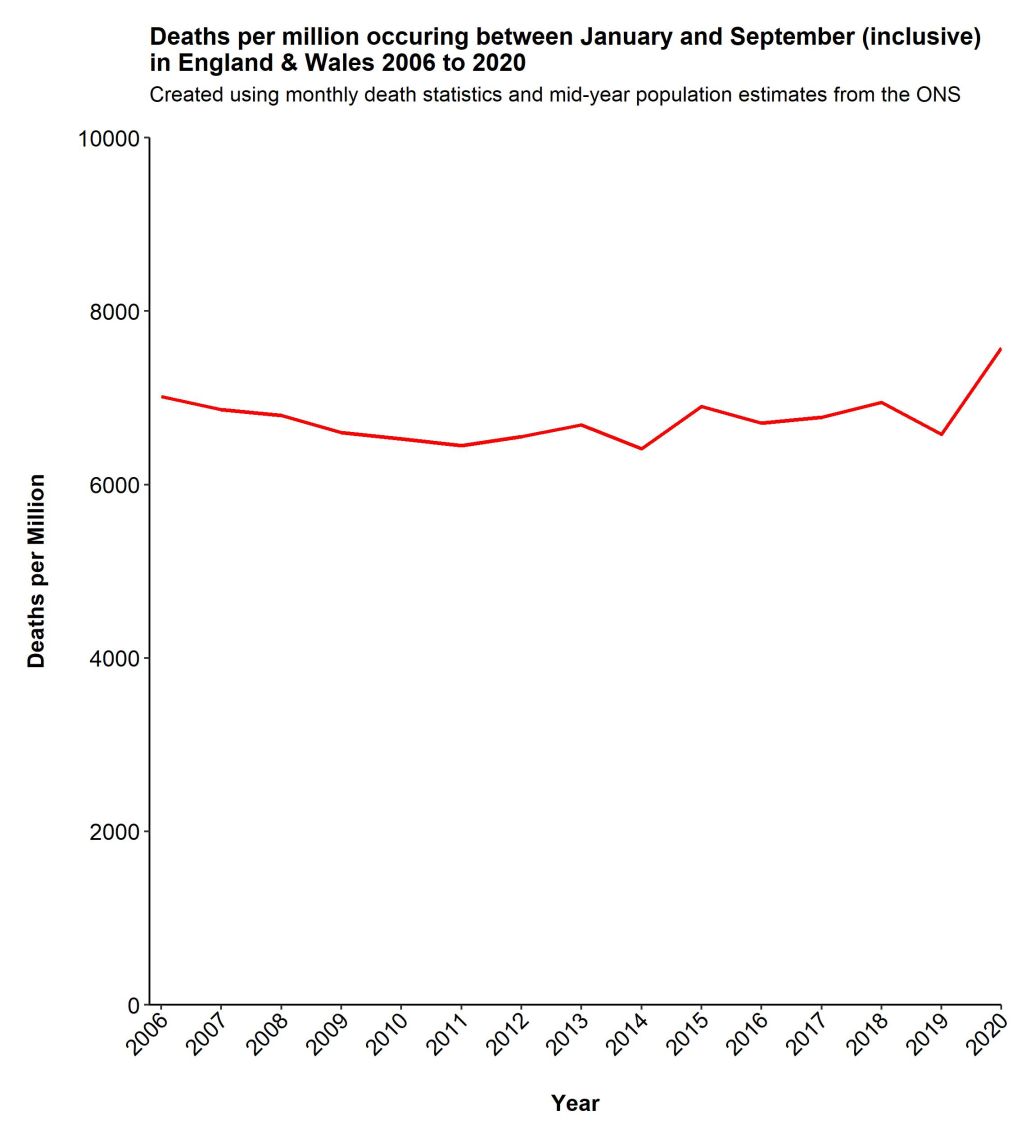
If it were deaths per thousand we’d be looking at about 7.5 per thousand for 2020 vs 7.0 per thousand for 2018 and 2006. So 2020 is a bit worse than those years, but it’s hardly the Black Death. Besides, we need to take into account the fact that in this total are (last time I looked) around 21,000 excess deaths that were ‘lockdown’ deaths, ie. they were not Covid deaths (and that’s not even mentioning the suspicion that many ‘with-Covid’ deaths were not really Covid deaths). So what the hell are we doing?
Update: Donations and book sales have been drying up recently, so I would appreciate it if you can send a donation my way (however small) via KoFi, or subscribing via SubscribeStar or Patreon, or buying my book (see right-hand sidebar for links). But I don’t blame anyone for holding onto their money right now!
6 thoughts on “All-cause mortality Jan-Sep 2006-20 graph from Mark Ashby”
> using ONS data
A more specific cite, pretty please? Otherwise, who is to say this is not made up?
Lockdown Skeptic – The data is stated in the subtitle. Monthly death statistics and mid-year population estimates.
https://www.ons.gov.uk/peoplepopulationandcommunity/birthsdeathsandmarriages/deaths/datasets/monthlyfiguresondeathsregisteredbyareaofusualresidence
https://www.ons.gov.uk/peoplepopulationandcommunity/populationandmigration/populationestimates/timeseries/enpop/pop
https://www.ons.gov.uk/peoplepopulationandcommunity/populationandmigration/populationestimates/timeseries/wapop/pop
The population data from England and Wales were combined to match the monthly death statistics (for England and Wales). Also, as mid-year population estimates aren’t available for 2020, I added the average increase in population between 2016-17, 2017-18 and 2018-2019 to the 2019 mi-year population estimate.
Thanks! If possible, could you (or anyone who knows how to find them?) link to (at least some examples of) equivalent data going back to say 1990? I’ve tried and failed to find such things on the ONS site which for my searches returns a random garbage dump of vaguely related but not useful results (suicides, infant mortality etc).
Lockdown Skeptic – Hector uses annual mortality and population data going back to 1838 in England and Wales in this excellent article:
https://thecritic.co.uk/this-is-what-we-amputated-a-limb-for/
The Mortality data is from the ONS, so it should be on the site somewhere or you may have to request it. As for the population data, I’m not sure where this comes from.
Anyway, Hector’s article shows that the mortality situation in 2020 is similar to the late 90s and better than anytime before that.
Re. comments above over ONS data.
It is quite hard to dig it out (irritatingly so) – but I managed to extract all weekly mortality data from 1993 to date (for England and Wales). See my analysis of the figures. I’d be happy to share the essential data as an Excel spreadsheet via Hector.
Recently, I’ve been looking to update the analysis of all-cause mortality as we enter this new period of a confected scare over normally rising autumn mortality.
In summary – tracking this year’s weekly mortality against the highest year in the period (1993) and the lowest (2011), we can see 2020 autumn mortality in the lower third of this range – raising the question ‘Crisis, what crisis?’
Here is the annual data for 1901-2019:
https://webarchive.nationalarchives.gov.uk/20160111174808/http://www.ons.gov.uk/ons/publications/re-reference-tables.html?edition=tcm%3A77-215593
https://www.ons.gov.uk/peoplepopulationandcommunity/birthsdeathsandmarriages/deaths/datasets/the21stcenturymortalityfilesdeathsdataset
Using this data, I’ve calculated annual excess deaths between 1960 and 2020. Excess deaths were calculated by comparing the annual number of deaths to the average of the previous five years. Obviously, 2020 is yet to finish so the annual number of deaths goes up to week 44 (ONS weekly death stats). But if you compare this number to the average number of deaths between 2015-2019, we are currently at -26,215 deaths. Given there are eight weeks left in the year and there are usually around 10K deaths per week, there will certainly be annual excess deaths by the end of the year. Around 53K excess deaths. But, bear in mind that there were 32k excess deaths in 2015 and just over 20k excess deaths in 2016, 2017 and 2018. Also bear in mind that excess deaths were extremely low last year (4K) and at least 20K deaths this year (probably more) are due to lockdown.
I’m also happy to share the above data I’ve compiled, just drop me an email at:
mashby@whitebeamecology.com
Comments are closed.