
How many excess deaths has Covid-19 caused in England and Wales? This is a trickier question than you might think. It isn’t just the number of people who are listed as a Covid death on the UK government’s website, which as of this day or writing (18th August) is 38,331 (it’s 41,381 for the whole UK.) As we know, many of these people died with Covid, but not of Covid. (In fact, judging by the numerous stories about doctors determined to put Covid on the death certificate without any good evidence, it seems that some of those people didn’t even have Covid.) We have no hard figures on how many people were really killed by Covid (and in fact it’s a difficult matter to decide what counts as ‘being killed by Covid’), but it’s unlikely to be 38,331.
But this isn’t the issue that I am concerned with in this article. I am concerned with excess deaths, that is, deaths that are over and above what you would normally get in a period without the disease or condition that is under examination. How many people have died from Covid who wouldn’t have soon died anyway? We know that Covid kills a lot of medically vulnerable people who were probably going to die soon anyway, or who were going to be finished off by the flu, etc. How many people were killed by Covid who weren’t in that condition? They’re the excess deaths. That’s the number we should be concerned with, not the number of Covid deaths.
ONS excess deaths
You might think this problem can be solved by looking at all-cause mortality excess deaths. The Office for National Statistics records, on the weekly deaths spreadsheet it puts out, the number of people who died each week, and also the five-year average for that week. Using that it can be worked out that since the start of the Covid crisis in week 11 there have been 57,635 excess deaths. But that figure is clearly not what we’re after either, because it will include all the extra deaths caused by lockdown itself, all the heart attacks caused by people too frightened to go into hospital, the deaths caused by cancer patients who had their treatment cancelled, and so on (which is why the excess deaths number is greater than the Covid-19 deaths number).
But, it might be said, the number of all-cause excess deaths, being higher than the Covid deaths number, tells us that the excess Covid-19 deaths number is just the same as the number of Covid deaths (while the difference between the overall excess deaths and the Covid deaths is the number of ‘lockdown’ deaths).
But this is too simple. There are two (related) problems with it. The first is that we don’t normally get diseases of this sort in spring. Normally they occur in winter. If this disease had happened to occur a few months earlier then it could have had the same effect as it did in April and May, but our methodology would not have produced anywhere near so many excess deaths in that scenario, because there are always more deaths in the winter months than spring, as this is the period when flus and similar diseases usually take hold, and this means that the five-year average for weekly deaths is higher in winter. In fact, the difference in the five-year average between winter and spring is often 3000-4000 a week. Thus the excess deaths calculated by this method could have been far less had Covid appeared in winter than spring, if we had had a winter without many flu deaths. (For a great discussion of how things would have looked had Covid occurred in winter rather than spring see Alistair Haimes writing on this site in May.)
It makes no sense to use a measure of excess deaths that could give very different answers for two possible scenarios, even though in both scenarios the exact same people, in the exact same physical condition, were killed in the exact same way. So I conclude that using the five-year average in this way isn’t a good method of getting a proper handle on excess Covid deaths, at least in this situation.
Excess winter deaths
The other issue that needs to be taken in to account here is the cyclic nature of excess winter deaths. Excess winter mortality, or EWM, is the phenomenon referred to above: more people die in the December-March period in the UK than the rest of the year. This phenomenon is observed in many other countries, not just the UK.
Helpfully the ONS publishes yearly records of the EWM for England and Wales going back to 1950. (I thank Hector Drummond Magazine reader Laurence Hodge who first let me know of this.) I have graphed this data for you. (The actual numbers are available in Appendix A. Note that all graphs can be clicked to enlarge.)
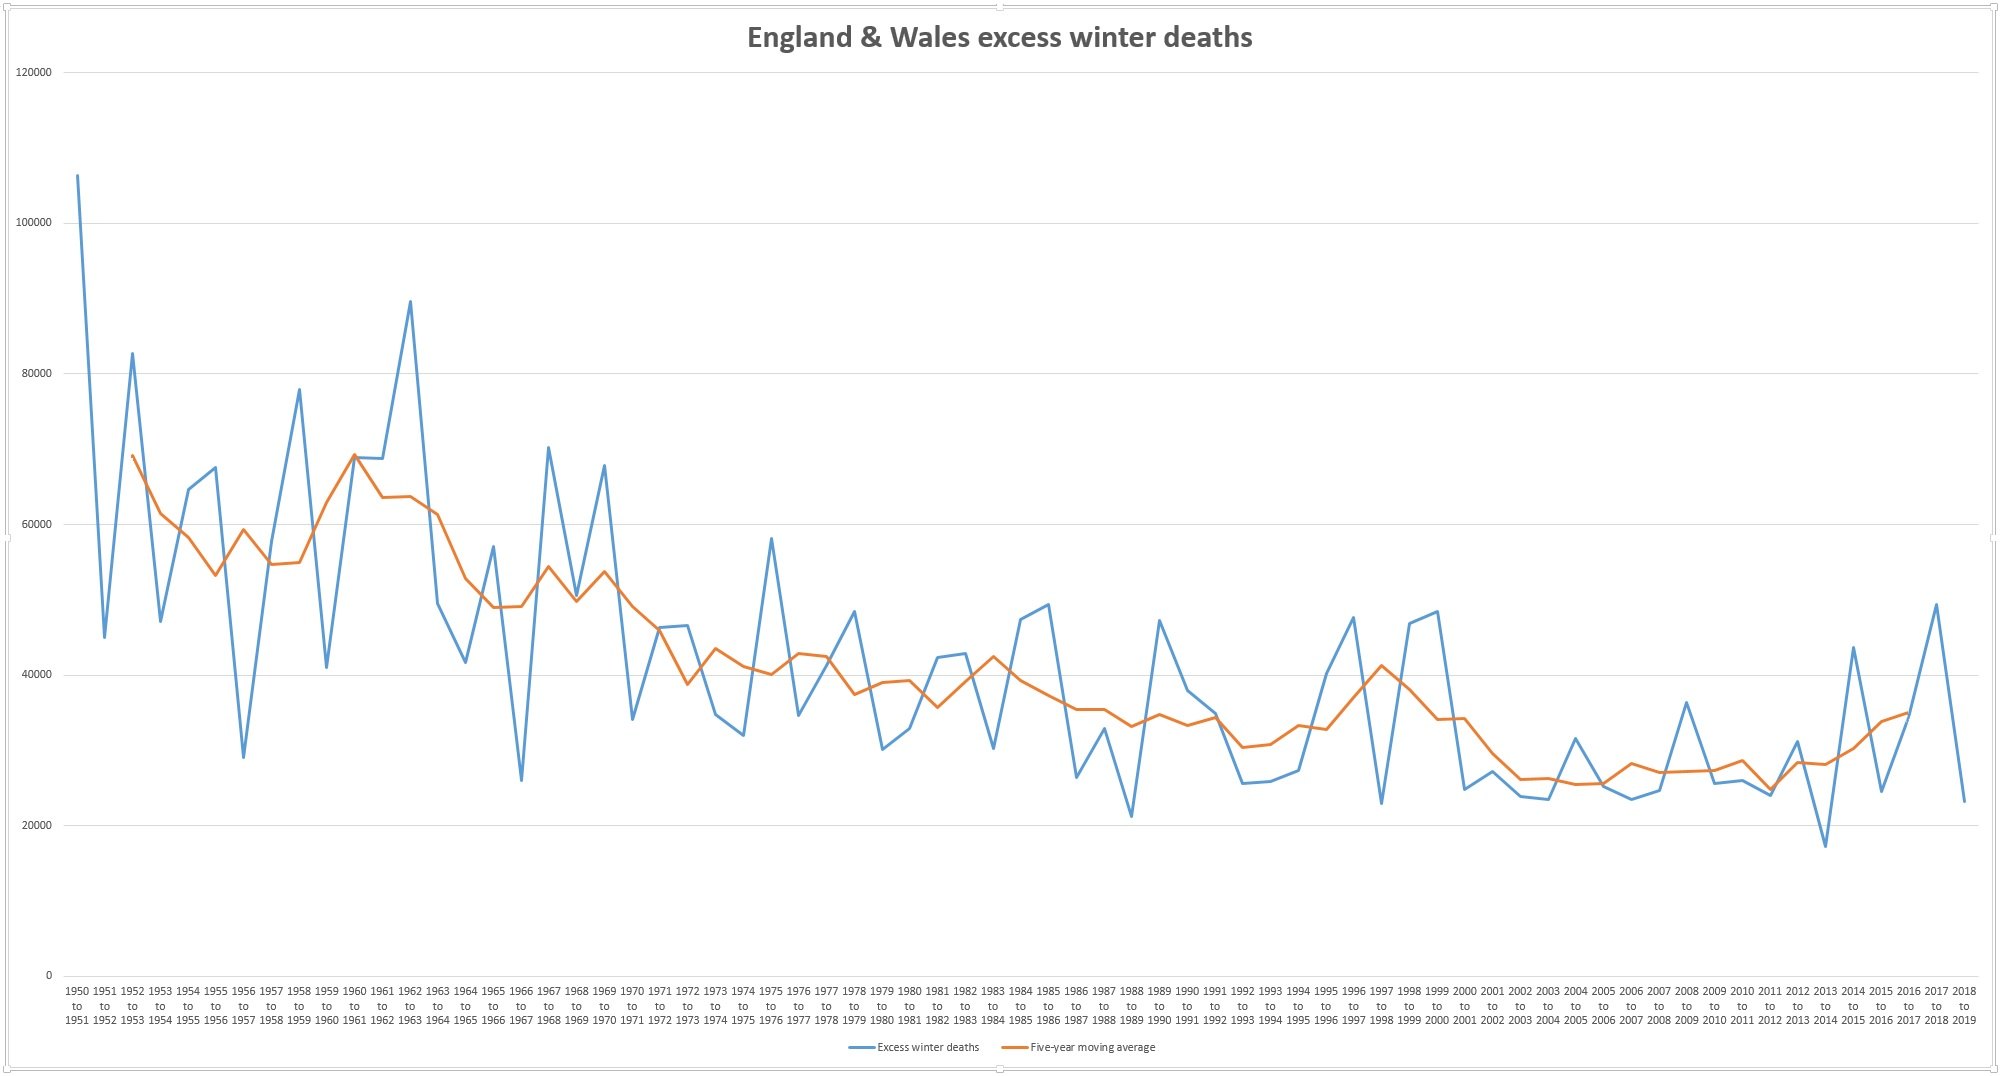
The orange line is the moving five-year average for EWD, which is calculated from two years before to two years after, which is why it starts two years after, and finishes two years before, the blue line.
Scientists aren’t entirely sure what causes the excess of deaths in winter, but generally it is thought that the main reason is influenza and other viruses which thrive in winter, and which finish off a lot of old people who are vulnerable. (Flu mainly kills older people, although it kills more young people than Covid does.) Even the common cold can finish off a lot of people who are near death.
(You might think cold temperatures play a part too, but actually the link between cold temperatures and EWD is not at all straightforward. Lower vitamin D levels caused by less sunlight may also be involved too. But these are issues for another time.)
The EWD seesaw
One thing we can notice right away from the graph is that the blue line, the number of deaths, zig-zags hugely from year to year around the average, often going up to the 40,000 mark and sometimes 50,000 and beyond, and often coming back down to the low 20,000s the year after. Occasionally you get two high years, or two low years, but mostly it it’s a yearly see-saw.
Some have speculated that probably a major factor in this see-saw pattern is that in a winter where the flu fails, for whatever reason, to get much of a foothold, or the dominant flu strain going around is a milder one, then many elderly people who would have been killed in a bad flu season survive it, and make it to next winter (especially if there is no heatwave over summer, which can also cause excess deaths). Such people are those who are physically very frail, or who have serious medical conditions, or who have weak immune systems (immune system efficacy normally declines with age), and who are generally very vulnerable to respiratory diseases. Luckily they make it through that less-bad winter, but the next winter they are killed by a worse strain of flu, or by a flu that managed to spread more that winter.
I have seen this explanation referred to on social media as the ‘dry tinder’ theory. It’s not a very nice term, but it does express the essence of the theory well.
Whether or not this really is the explanation of the zig-zag pattern (or, more likely, a part of the explanation), it is clear that a winter with low excess deaths is likely to be followed by a winter with high excess deaths. And if not that winter, then it’s likely that the next winter again will have a high number of excess deaths. There are a few exceptions to this (for example four low winters from 2001-2003-04), but in general it is true that a low winter is likely to be followed by a high winter, and two low winters is even more likely to be followed by a high winter.
We can see from our graph that winter 2018-19 was a low winter. In fact, at 23,200 it had the fourth-lowest excess winter death toll in the last seventy years. So most likely we were due for a large rebound in winter 2019-20. Could some of the Covid deaths that we have seen in spring 2020 be deaths that were likely to have happened anyway had we been hit with a bad flu in winter 2019-20? Was the winter just gone a mild winter for deaths? If so, if we had two mild winters in a row (‘mild’ here refers to death numbers, not weather), then wouldn’t we have had an awful lot of ‘dry tinder’ for Covid to ‘burn’ through in spring?
Getting clearer on what ‘excess winter deaths’ is
Before we can answer that question, though, there’s something we need to get clearer on. What the ONS calls ‘excess winter deaths’ are not what you may think they are. They are not the actual numbers of people who died that winter over and above an average (such as a five year average) for that time of year. In actual fact these numbers are relative numbers. More specifically they are the numbers left over when you subtract the non-winter deaths from the winter deaths. The winter deaths are taken from the start of December to the end March, and the non-winter deaths are the preceding August to November and the following April to July. The ONS says:
our standard method defines the winter period as December to March and compares the number of deaths that occurred in this winter period with the average number of deaths occurring in the preceding August to November and the following April to July. The calculation used is:
EWD = winter deaths – average non-winter deaths [section 11]
As there are, in the ONS’s categorisation, eight non-winter months and four winter months, we can presume that by ‘average’ non-winter deaths they mean that they halve the numbers for the non-winter months (it is typical of the ONS to be vague about this sort of thing).
So these are relative numbers that depend partly upon the number of winter deaths, but also partly upon non-winter deaths too, and the latter can vary from year to year, not as much as winter deaths do, but to some extent. Look at this graph that David Clark did for another blog post of mine to see this.

Raw winter death numbers
To get a more accurate handle on winter deaths I realised I would have to look at the raw data for the December to March period. The ONS publish monthly death totals going back to 2006, so I added together the December to March totals for each winter . I then added in the EWD totals. Here are the totals.
| Winter | Deaths | EWD |
| 2019-20 | 197,551 | Not yet available |
| 2018-19 | 185,191 | 23200 |
| 2017-18 | 209,689 | 49410 |
| 2016-17 | 199,353 | 34410 |
| 2015-16 | 187,652 | 24500 |
| 2014-15 | 205,277 | 43720 |
| 2013-14 | 174,232 | 17280 |
| 2012-13 | 184,136 | 31150 |
| 2011-12 | 179,138 | 24040 |
| 2010-11 | 181,845 | 25960 |
| 2009-10 | 180,318 | 25660 |
| 2008-09 | 192,467 | 36330 |
| 2007-08 | 180,332 | 24620 |
| 2006-07 | 179,749 | 23540 |
And this is what these numbers look like when graphed.
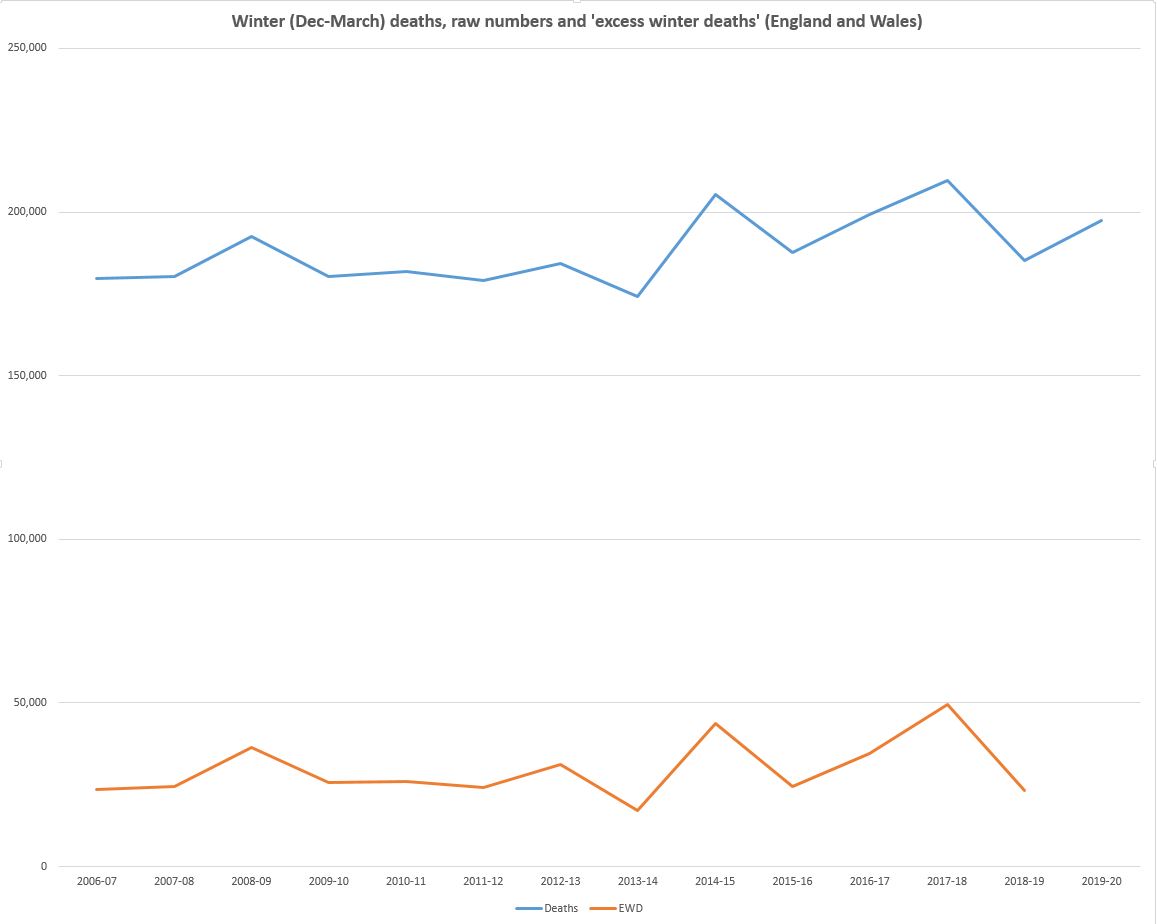
It can be seen that the EWD numbers roughly track the raw numbers, only at a lower level. To make this clearer, I worked out the differences from one winter to the next for both the raw numbers and the EWD numbers, and this was the result.
| Winter | Difference-raw | Difference-EWD |
| 2018-19 | -24,498 | -26,210 |
| 2017-18 | 10,336 | 15,000 |
| 2016-17 | 11,701 | 9910 |
| 2015-16 | -17,625 | -19220 |
| 2014-15 | 31,045 | 26,440 |
| 2013-14 | -9904 | -13,870 |
| 2012-13 | 4498 | 7110 |
| 2011-12 | -2707 | -1920 |
| 2010-11 | 1527 | 300 |
| 2009-10 | -12,149 | -10670 |
| 2008-09 | 12,135 | 11,710 |
| 2007-08 | 583 | 1080 |
I then graphed these numbers.

While the numbers aren’t exactly the same, they’re close enough to enable us to presume that the EWD numbers are a pretty good proxy for the absolute winter numbers. (In fact, they’re much closer than I expected them to be). But anyhow I shall mainly make use of the absolute numbers in the rest of my analysis.
What should we have expected in winter 2019-20?
So: back to the ‘dry tinder’ idea, the idea that some of the 2020 Covid deaths were deaths we would have expected anyway from the usual yearly oscillation, especially if the winter of 2019-20 had not seen a high number of deaths.
First of all, we can ask how many excess winter deaths could we have ordinarily expected in winter 2019-20 (assuming a world where there was no Covid)? Here, though, we run into a problem. There’s no way of getting anything more than a large, ballpark numerical range for this. We know that there’s a fairly regular rebound pattern, but the numbers vary greatly, in a semi-random fashion. There’s no great regularity to how bad the bad winters are, so really, it’s impossible to be precise. But we could say, with some confidence, that most likely 2019-20 would be a bad winter, and it’s more probable than not that we would see over 200,000 deaths in the period. (Anyone who wants to run a more rigorous stats analysis, please feel free to do so and send it to me.)
We often see a rise of 10,000 to 30,000 in the winter after a milder winter, so as winter 2018-19 saw 185,191 deaths, it’s quite likely that winter 2019-20 would see between 195,000 to 215,000 deaths. Looking at the raw figures back to 2006-07, 209,000 was the highest (in 2017-18), so we wouldn’t expect 215,000 unless it was a pretty bad winter, but getting over 200,000 was probable. As numbers in excess of 200,000 have been reached twice in the five-year period before this winter, that would not be anything out of the ordinary.
What actually happened in winter 2019-20?
So what did happen in winter 2019-2020 in England and Wales, the winter just gone? To work that out I added up the relevant weekly totals from the ONS spreadsheet, took away the days at the end of November and the start of April that were in there (assuming proportionate deaths for each day of the week), and got the answer 197,754.
(Note that ONS can’t calculate their EWD number for this winter until they’ve seen what the non-winter death figures will be like for some of this year, because they are used for calculating the winter excess. In fact, the official EWD figure for this winter is going to turn out to be very low, misleadingly low, because of the unusually high number of spring deaths – remember that EWD, as the ONS understands it, is calculated by a comparison to non-winter deaths.)
But some of that 197,754 are the Covid deaths that happened at the end of March, and we don’t want to include them because then we’d be double-counting when we come to look at the Covid numbers in the context of the winter deaths that had just happened. I calculate that there were 2131 Covid deaths in that number by 31 March, so our final number for winter 2019-20 deaths not including Covid is 195,623.
This is not, by recent standards, a particularly mild winter. There have been plenty of milder winters with deaths in 170,000s and 180,000s. So it is not true that we have had two mild (in the sense of relatively non-deadly) winters in a row. Nor, in fact, was 2018-19 unusually low when we look at in terms of the raw numbers, although it is in the lower half of usual range.
Subtract 20,000 deaths?
But on the other hand, 195,623 is at the lower bound of the range we decided was probable for winter 2019-20, which was 195,000-215,000. In other words, we could well have got another 20,000 deaths over the winter had we had a more dangerous flu going around. So we can conclude that it is somewhat probable that there were up to 20,000 elderly and/or medically vulnerable people who survived the December-March flu period, but who were at serious risk of death from any nasty viruses that happened to be around after that. The fact that they succumbed to Covid-19, which is a nasty disease, is, while sad, no great surprise, and also no cause for alarm, as these people could easily have died over winter when we would not have even noticed anything unusual happening, and we certainly would not have shut down the entire country for that.
So up to 20,000 of our 38,331 Covid deaths, over half, could have simply been deaths that could easily have happened anyway over winter, which would have been considered of no consequence for the overall health of the nation. Many of these people could have been expected to die by next winter anyway. I’m not saying that we shouldn’t care about such people and their slightly shortened lives, but considered from an objective, public health perspective, this is nothing to get worked up over.
If up to 20,000 of the Covid victims could have died anyway from an established disease like flu, then possibly only 18,000 Covid deaths can be considered ‘excess’ Covid deaths (although it should have become clearer now that it is difficult to get any solid grasp on what we really mean by an ‘excess’ Covid death). And seeing as up to a half of Covid deaths may not really be Covid deaths, or could be deaths in which Covid only played a small part, perhaps hastening death by a few days or weeks, we possibly have very few ‘excess’ Covid deaths at all.
Sticking to 38,000
Even if you want to take a more hardline view, and claim that all 38,331 Covid deaths really are excess deaths, we still don’t have anything that major. A bad flu season can kill more people than that. (One of my next projects is to look into flu deaths more closely, unless someone else can do that.) Neither is a good thing, of course, but the point is that flu seasons have never worried us, and have not resulted in the insane measures taken by governments around the world, including the UK government. What should worry us are the excess, unprecedented, non-Covid ‘lockdown’ deaths, which are an absolute scandal, but which have been ignored by the media.
Isn’t it mostly ‘dry tinder’ anyway?
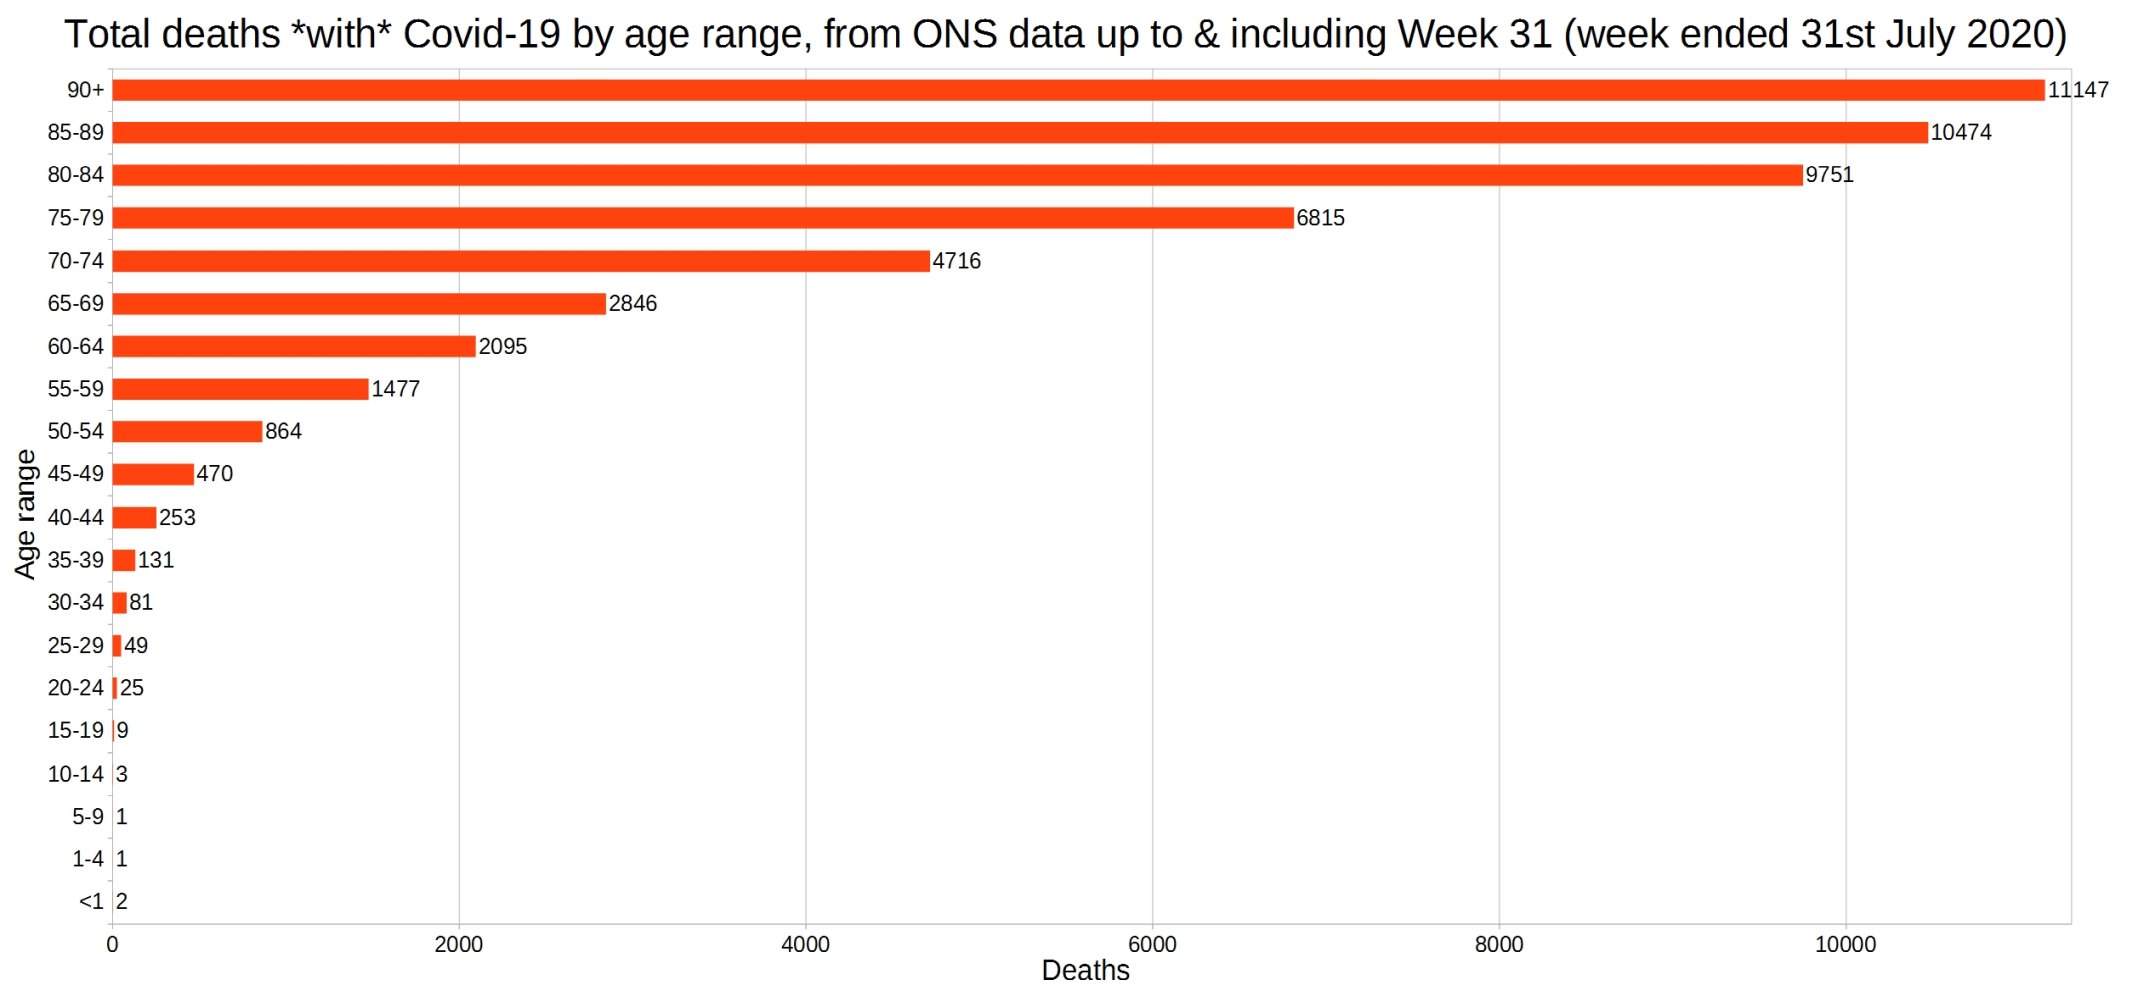
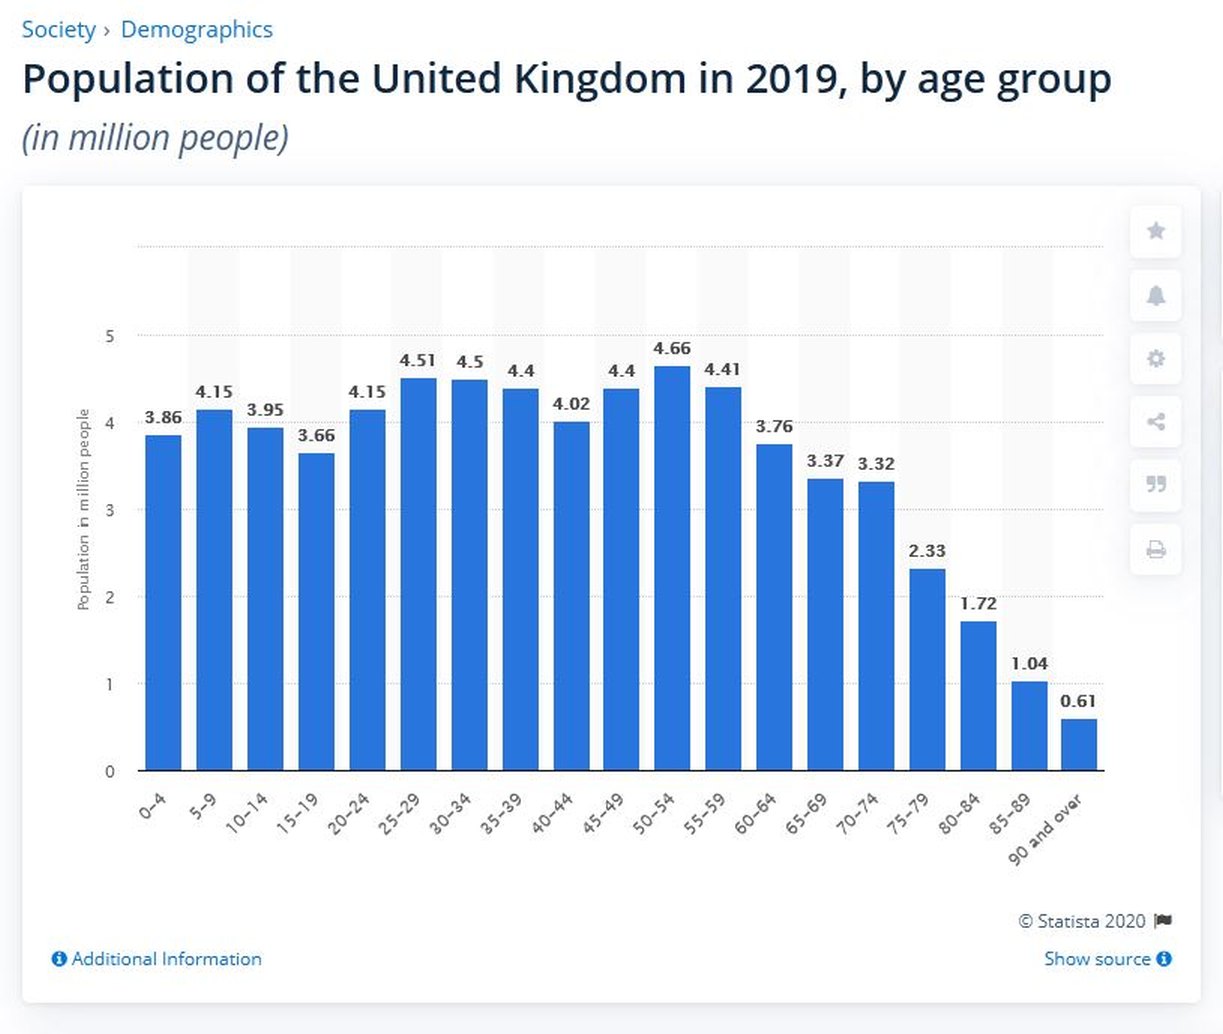
We also need to bear in mind that almost all Covid deaths are in very elderly people.
And elderly people with other serious conditions, serious enough to be mentioned on their death certificates as a probable contributor to their death.
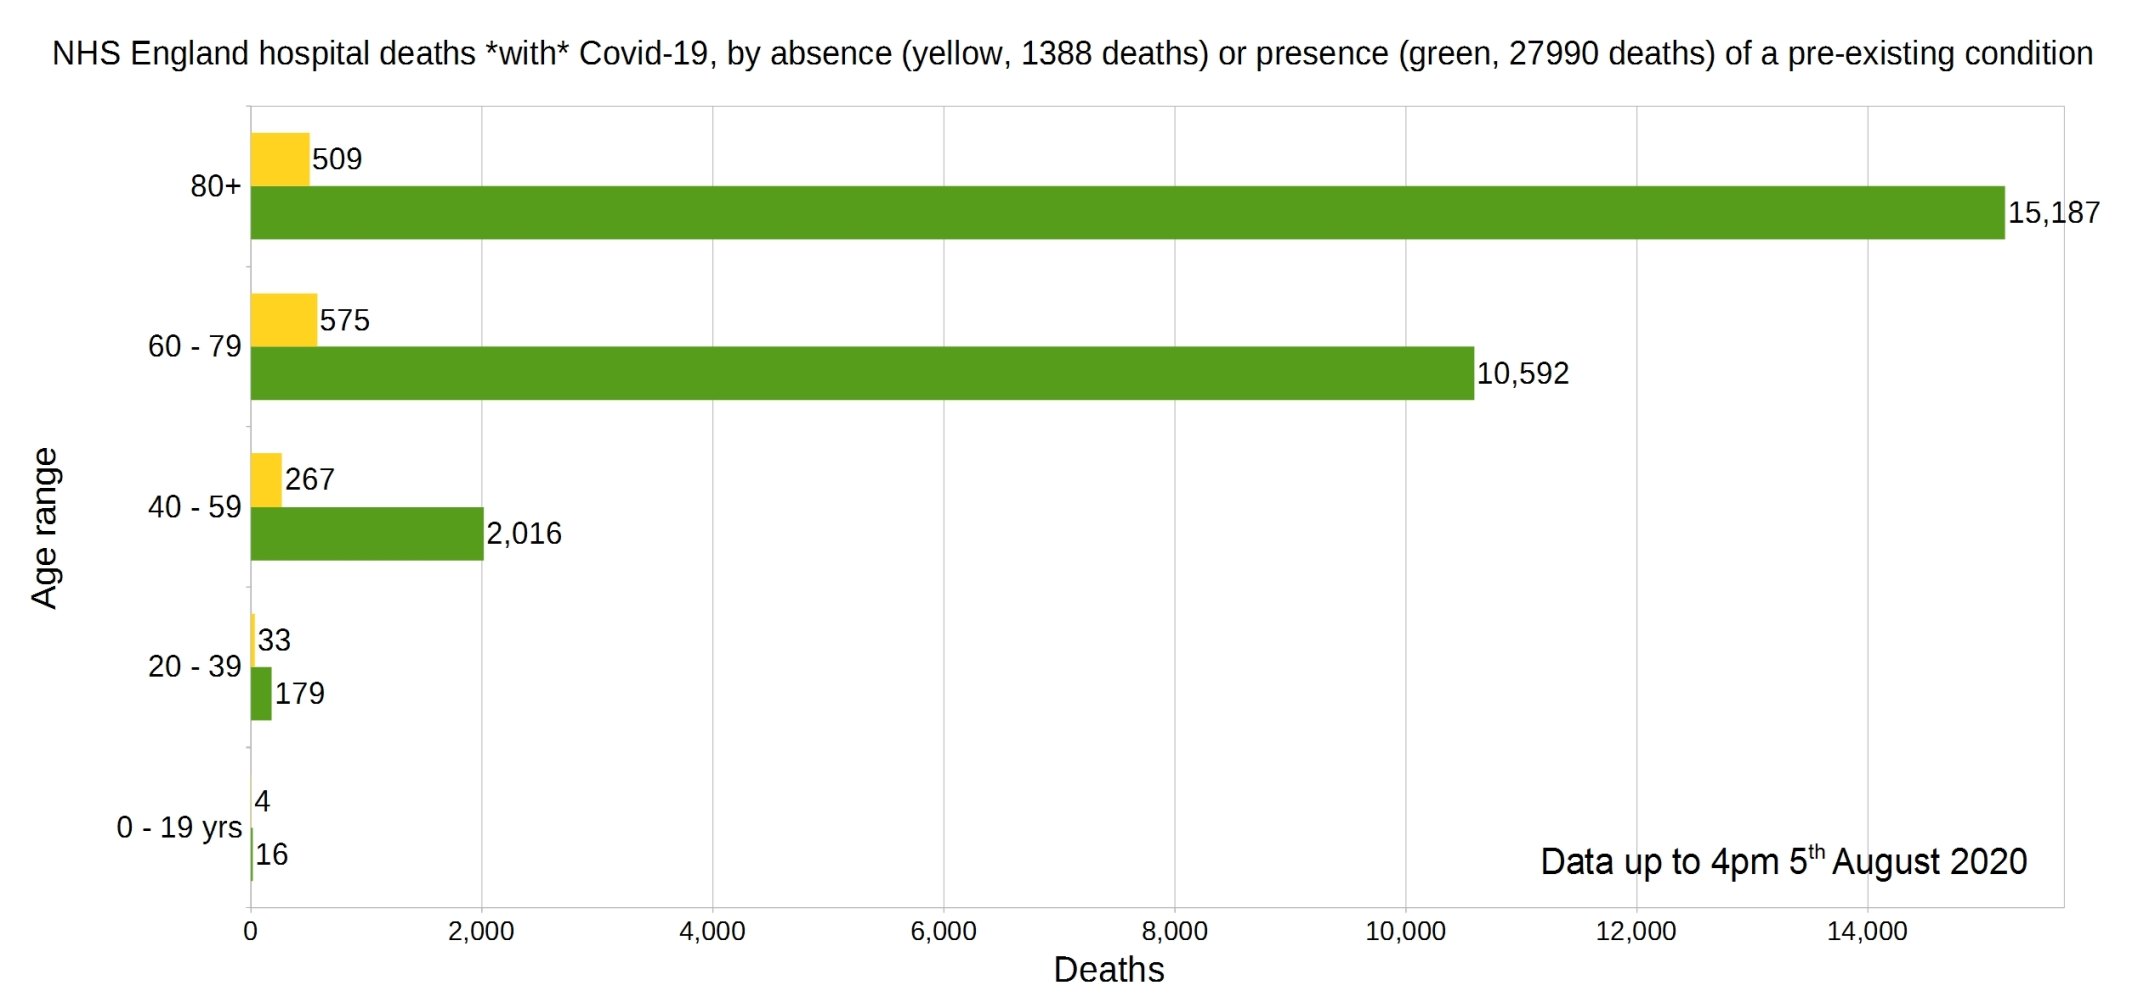
These two graphs (from Christopher Bowyer) themselves tell us that some form of ‘dry tinder’ theory is right. It’s not like the 20,000 people I mentioned earlier were the only elderly people at risk of death from viruses that aren’t fatal for most other people. They’re the most vulnerable. But there’s hundreds of thousands of very old people in the country whose time is almost up. There are over three million people in the UK who are aged over 80, and they die off rapidly as they age – only about a third of those aged 80-84 make it to 90, and well over four-fifths of people aged 70-74 are dead before they reach 90. This may sound like I’m being callous, but I’m not. It applies, or will apply, to people I love as well. And me. And you. If you think you’re likely to make it to 100, think again. (You may do if you’re lucky, but you’re not likely to.) Besides, it’s just a fact. Like it or not, it’s true.
Some of these people are the ones who are also being killed by Covid. They’re the ones who die a bit before their time in the winters when an extra bad flu hits, or in the summers when a really bad heatwave takes place. I don’t want them to die when they might have had some more time left, but that’s a completely different thing than panicking that we have a major killer disease on the loose which is an existential threat to society. That would be a disease that kills large numbers of younger and fit and strong people. Covid-19 is not that disease, because it hardly kills any young people. Covid-19 mainly takes people who are in God’s waiting room. It is not a significant killer compared to other normal, established diseases like flu, it is in the same ballpark as them. It does not cause unusually large numbers of excess deaths of people who were not already near the end of their life. Governments should consider it as another flu-like illness, because that is what it is.
(Some might argue that without the lockdown vastly more people would have been killed, of course, but I think it’s very clear now that lockdowns are useless.)
Rick Hayward’s analysis
There are, of course, many other things to take into account with Covid, some of which have been published on this site in the last few months, but I would urge you to read, if you haven’t already, this Rick Hayward piece from July, because the focus of that is somewhat similar to this article, but it’s a far more useful and precise piece, and Rick also made the effort to work out the winter-spring mortality for the last 27 years. (Plus that piece should have got far more publicity than it did, it’s devastating, and I’m angry that it isn’t all over the media and the internet.)
Update: Please support my work by donating via Ko-fi, or subscribing via Patreon (see right-hand sidebar). Will sort out SubscribeStar soon for those who don’t like Patreon. Or buy my novel. This website receives no funding other than individual donations made by my brilliant readers, and I have been working full-time here and on Twitter for half a year now for virtually nothing to combat the tide of Covid misinformation and woke insanity.
Update 2: Another thing to note is that the EWD numbers show us that, far from being an unprecedented once-in-a-century mass killer, Covid-19 hasn’t even killed as many people as the cold and fogs of the 50s and 60s did. A population adjusted-graph would show this even more clearly. On that, see my historical post – another post which should be all over the media and the internet – here.
Appendix A:
The ONS’s EWD numbers (from here).
| Winter | EWDs |
| 1950-51 | 106400 |
| 1951 -52 | 44950 |
| 1952-53 | 82670 |
| 1953-54 | 47180 |
| 1954-55 | 64670 |
| 1955-56 | 67560 |
| 1956-57 | 29080 |
| 1957-58 | 57780 |
| 1958-59 | 77920 |
| 1959-60 | 41060 |
| 1960-61 | 68880 |
| 1961-62 | 68820 |
| 1962-63 | 89600 |
| 1963-64 | 49510 |
| 1964-65 | 41730 |
| 1965-66 | 57120 |
| 1966-67 | 25990 |
| 1967-68 | 70260 |
| 1968-69 | 50630 |
| 1969-70 | 67790 |
| 1970-71 | 34110 |
| 1971-72 | 46270 |
| 1972-73 | 46630 |
| 1973-74 | 34710 |
| 1974-75 | 31920 |
| 1975-76 | 58100 |
| 1976-77 | 34590 |
| 1977-78 | 41240 |
| 1978-79 | 48490 |
| 1979-80 | 30120 |
| 1980-81 | 32900 |
| 1981-82 | 42380 |
| 1982-83 | 42820 |
| 1983-84 | 30240 |
| 1984-85 | 47380 |
| 1985-86 | 49330 |
| 1986-87 | 26370 |
| 1987-88 | 32970 |
| 1988-89 | 21160 |
| 1989-90 | 47200 |
| 1990-91 | 37940 |
| 1991-92 | 34850 |
| 1992-93 | 25650 |
| 1993-94 | 25880 |
| 1994-95 | 27290 |
| 1995-96 | 40190 |
| 1996-97 | 47700 |
| 1997-98 | 22950 |
| 1998-99 | 46810 |
| 1999-2000 | 48420 |
| 2000-01 | 24790 |
| 2001-02 | 27230 |
| 2002-03 | 23930 |
| 2003-04 | 23420 |
| 2004-05 | 31570 |
| 2005-06 | 25190 |
| 2006-07 | 23540 |
| 2007-08 | 24620 |
| 2008-09 | 36330 |
| 2009-10 | 25660 |
| 2010-11 | 25960 |
| 2011-12 | 24040 |
| 2012-13 | 31150 |
| 2013-14 | 17280 |
| 2014-15 | 43720 |
| 2015-16 | 24500 |
| 2016-17 | 34410 |
| 2017-18 | 49410 |
| 2018-19 | 23200 |
18 thoughts on “Covid-19 excess deaths, ‘dry tinder’, and the winter deaths seesaw”
I have two very well educated sons following very different careers, one in UK and one in US. They are perfectly able to understand the concepts and statistics in your and fellow contributors articles. I share some of the best ones with them to encourage their questioning of the messages they receive from the government(s) and media.
I get depressed by the reaction or lack of it. They both, in different ways do not want to accept they are being lied to. Partly because they have received indoctrination that any other news/info source other than officially approved ones carries ‘fake’ news; and partly because I think they are worried that to admit these lies would open up the pandora box on lies elsewhere, and that would undermine their world they are trying to navigate and make lives in.
If my experience is common, then the psyop has been remarkably successful, and explains why the majority of citizens are apparently content to lose personal freedoms for the sake of ‘civic duty’ and ‘safety’.
Most people are just waiting to be told what to do next, they actually physically/mentally don’t want to be told its all a load of rubbish. The implications of that scare them far more than loss of freedom or mandatory vaccinations.
My god how easy it has been!
“Many of these people could have been expected to die by next winter anyway. I’m not saying that we shouldn’t care about such people and their slightly shortened lives, but considered from an objective, public health perspective, this is nothing to get worked up over”.
From the remarks I often see online, as well as in the mass media, it sometimes seems as if death from any cause and at any age is resented and looked upon as a result of carelessness by someone.
That may well be a result of our culture, which desperately pushes death under the carpet and pretends that it doesn’t exist. (Although, ironically, young people see thousands of the most vicious and cruel murders on TV and in films).
Thanks to Hector for adding Appendix A (the final table). It shows with devastating clarity how much worse the death toll of seasonal infections was in the 1950s and 1960s.
Excess winter deaths have not reached 50,000 since 1975-6 (58,100). But just look at the very first row: 1950-1; 106,400 excess winter deaths! More than four times last winter’s, and more than double the (rather bad) 2017-8. Of course in 1950-1 austerity was still in full swing; most people got barely enough food, and not enough of the best kinds; fuel and clothing were scarce (as was everything else). London smog killed 12,000 in December 1952 alone; in one of his books James Lovelock claims 5,000 died in a single day.
Then there was 1958-9; 77, 920 EWD. 1962-3; 89, 600 EWD. And 1967-8; 70,260, 1968-9; 50,630, and 1969-70; 67,790. That’s an average of nearly 63,000 per year for a three-year period! (Twice what is being, rather dubiously, claimed for Covid-19).
As it happens, I lived through that period as a child. 1966-9 were exactly the years I spent at university. During those years I maintained detailed diaries, and also wrote and received a lot of letters. In all those papers there is not one single mention of an “epidemic” or a “pandemic”. The newspapers, TV and radio were not full of it either.
Throughout all those periods of EWD far higher than anything we have seen since 1976, people just went on living their lives. Scientists had not begun to pick apart viruses and meddle with the immune system, so it was just taken for granted that people got ill, and sometimes (especially when old) they died.
JimW`s comments reflect the exact reactions I have had from my well educated daughter and son. My son has a degree in microbiology but this seems to have made no difference. I have followed the “pandemic” and from almost the start could see that things did not add up but my children feel that I must be wrong. I must be listening to too many conspiracy theorists and alternative media sources. Sites like Hector`s and Lockdown Sceptics cannot possible be giving a realistic alternative and correct viewpoint. I fear for them and my grandchildren`s future freedoms and liberties. I fear that they will be forced to have an unnecessary and untested vaccine because they cannot see they have been indoctrinated. It is so very sad.
Same experience as Jim W and Christine Hudson, sadly. My highly educated sister in Germany stopped talking with me for while because in her view I have become a conspiracy theorist. Now we can’t touch the subject that is the most pressing of our time. Same goes for other highly educated members of the family. They don’t want to hear, they prefer to believe that all will end soon and “what’s the fuss about vaccines anyway”. Totally brainwashed by years of synchronised mainstream news. Nobody is interested in civil and human rights any longer. Where will this lead to …
@Hector
First:
When are you going to cover weekly Flue deaths five times greater than C-19 since mid June – and now six times greater than C-19? ?
Wonderful article. Thank you
Exactly, and what I’ve been posting since late February eg
.
Correct ~0.9% of UK population die every year. A caveat on pre-existing, it’s diagnosed pre-existing. Many, even young, have undiagnosed conditions
Gov’t have destroyed economy and peoples lives due to blind panic, incompetence and refusal to lead. We don’t have a Prime Minister, we have Chicken Little
@JimW
Similar here. They go silent, then move on – does not compute syndrome. Not only younger, but pensioners too. They even admit they know Gov’t and msm lying, then: but, but, others, law, rules…. Sheep
Excellent ‘Postcard from Sweden’
“Left-wing circles, attacked Sweden as a dystopian disaster zone”: this has been the most amusing aspect. Sweden, their ‘Socialist Utopia’ has been cancelled
JimW, Christine, Ursula — it may be that what we are seeing, especially with well-credentialed but poorly-educated young people, is simple old Peer Pressure.
Peer Pressure influences everything, from the fascists of Antifa throwing feces at the police to Boards of Directors making decisions on nuclear power plants. Personally, I despise the expression “herd immunity”; but if we are honest with ourselves we have to accept that humans evolved as herd animals. As some author once wrote: “A man alone does not stand a chance”. Sticking with the group was one of the keys to survival over a very long evolutionary period.
Bottom line is that it takes a certain type of personality reinforced by uncommon education or experience to get an individual who can reach conclusions which are at variance from those of her Peer Group. Sad fact is that we human beings often exhibit lemming-like behavior. Have you looked at the stock market recently?
Interesting question is — How can we influence Peer Pressure in a positive direction? I don’t think anyone has cracked that problem.
Tom Welsh; “Thanks to Hector for adding Appendix A (the final table). It shows with devastating clarity how much worse the death toll of seasonal infections was in the 1950s and 1960s.”
…..and that doesn’t even allow for a 20% increase in population compared to today!
@Gavin
The tendency of politicians to surrender to peer pressure demonstrates how weak they are
In my teens all my biker mates smoked dope, many other friends got drunk – I did neither, despite much mocking & pressure
Stock markets up because Gov’t QE has debased currency. Increase is to soak up the new money being created. Same happened in 2008
Pointed out to a well educated friend just the simple facts of how many people per 1,000 locally were infected and the odds (per 1,000) that he would be the one to have a fatal case and that if he put together the chance of catching it AND keeling over from it then the odds were remarkably low.
Didn’t make any difference, lot of the public think the risk of infection and death are high or the govt. wouldn’t be making all this fuss.
Refreshingly went camping on the weekend and at a campsite 60 kms from the main highway (last 20km was gravel road) and there wasn’t a mask in site, people greeting each other passing by the campsites and everything felt very relaxed and normal; though the govt. restrictions had closed the shower block of course.
An excellent analysis, Hector.
Whichever way you look at this, the only really unusual feature was the timing of the mortality spike, and we have both come to the conclusion that it is highly likely that the mortality figures of that spike were inflated by what you call ‘dry tinder.
“So up to 20,000 of our 38,331 Covid deaths, over half, could have simply been deaths that could easily have happened anyway over winter, which would have been considered of no consequence for the overall health of the nation. ”
Meanwhile, I guess those of us who are sane have to go on trying to find ways of living in Airstrip 1, where – true to the pattern of torture victims, there is a pathetic seizing of any mild relaxation of totalitarian measures – rather than fury at the original imposition.
Comments are closed.